Free Access
Fig. 2.
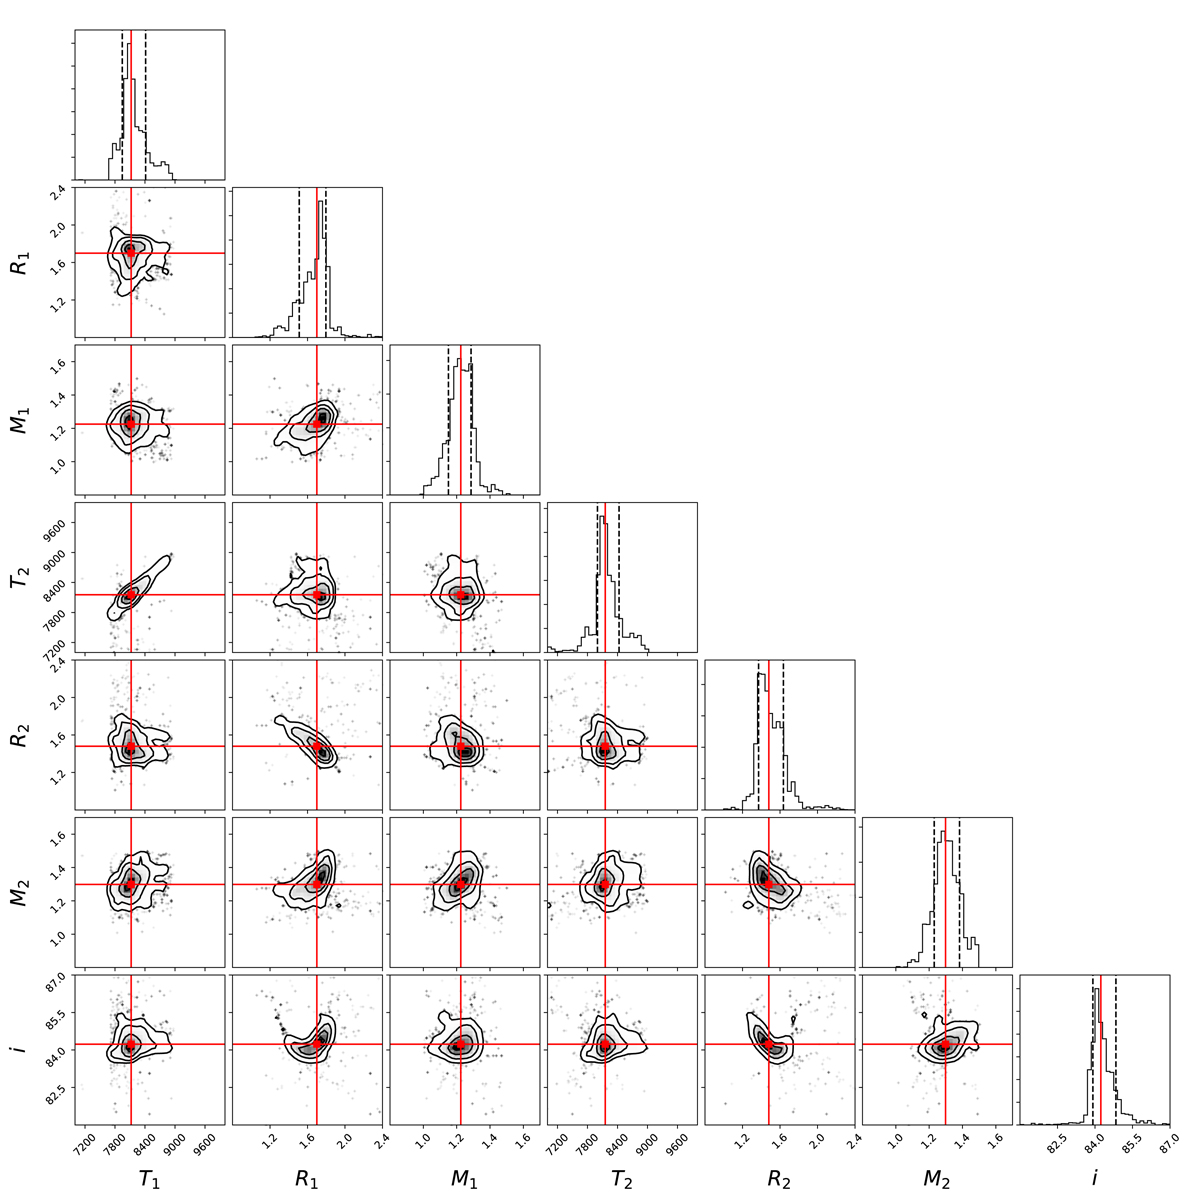
A corner plot for the PHOEBE 2.0 MCMC fit to the light curve. Indicated are the temperature, radius and mass of the two stars, as well as the orbital inclination. The red lines represent the most likely values, while the dashed lines reflect the one-sigma limits.
Current usage metrics show cumulative count of Article Views (full-text article views including HTML views, PDF and ePub downloads, according to the available data) and Abstracts Views on Vision4Press platform.
Data correspond to usage on the plateform after 2015. The current usage metrics is available 48-96 hours after online publication and is updated daily on week days.
Initial download of the metrics may take a while.