Fig. 8.
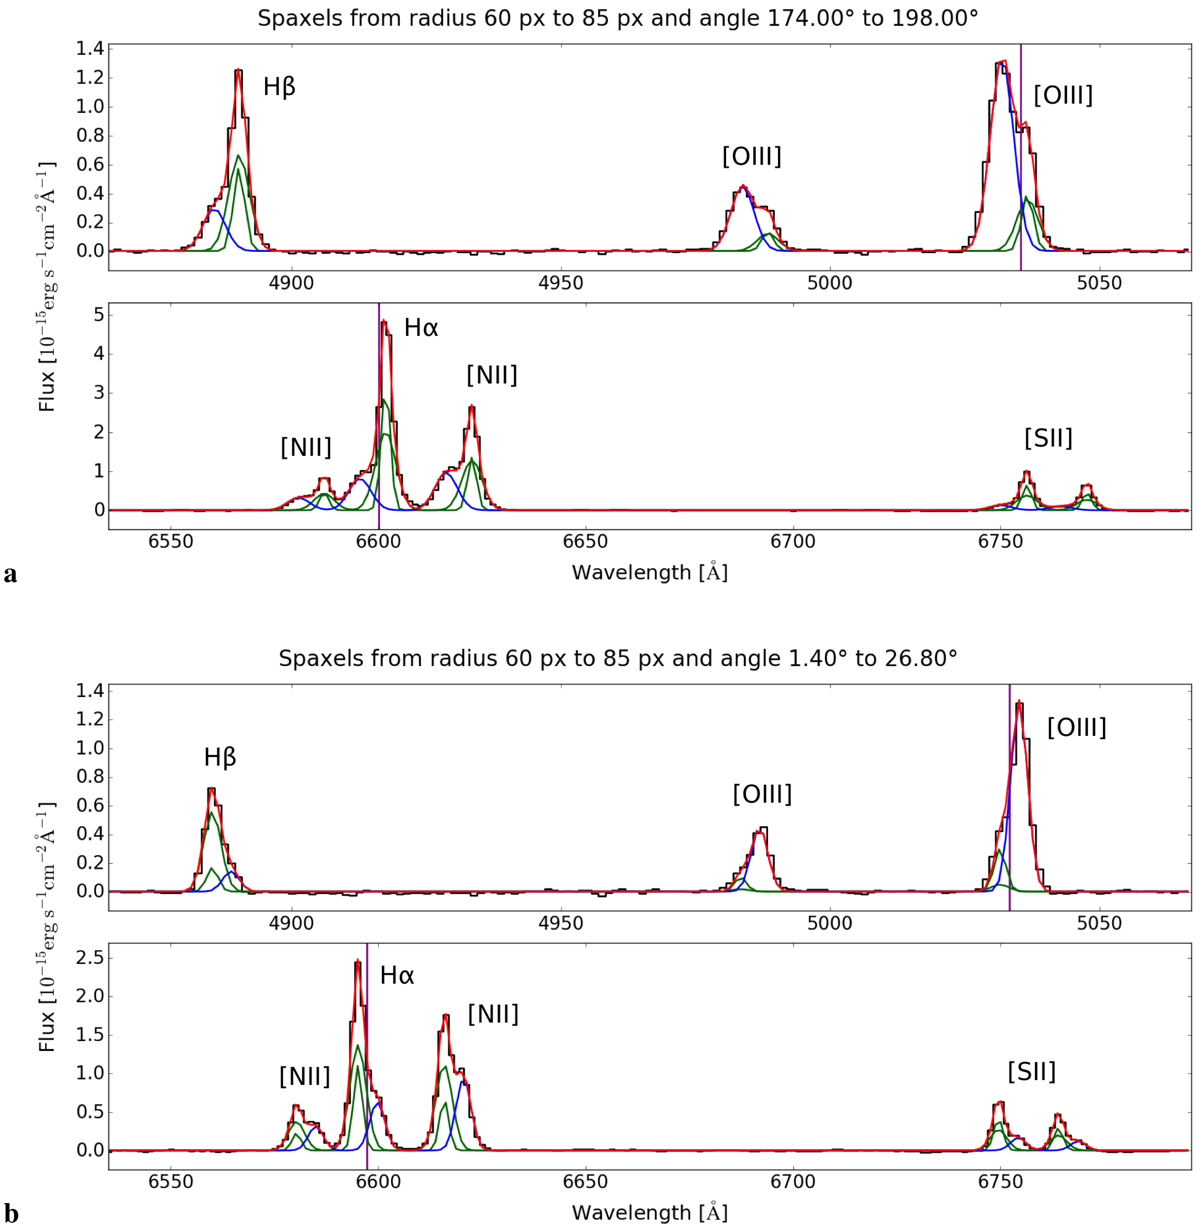
Fit of [O III], Hβ, [N II], Hα, and [S II] lines for two elements of the grid through which we divided the outfowing cones (see Fig. 7). The spectrum in panel a belongs to the SE blueshifted cone, the spectrum in panel b to the NW redshifted one. The blue Gaussian corresponds to the outflow kinematic component, the two green Gaussians (having the same velocity) to the disk; the velocity and velocity dispersion of all the Gaussians are tied between the lines. The purple vertical lines at [O III] and Hα wavelengths mark the stellar velocity for the element of the grid considered, obtained from the stellar kinematics presented in Fig. 6a. The reported wavelengths are in the Earth rest frame.
Current usage metrics show cumulative count of Article Views (full-text article views including HTML views, PDF and ePub downloads, according to the available data) and Abstracts Views on Vision4Press platform.
Data correspond to usage on the plateform after 2015. The current usage metrics is available 48-96 hours after online publication and is updated daily on week days.
Initial download of the metrics may take a while.