Fig. 5.
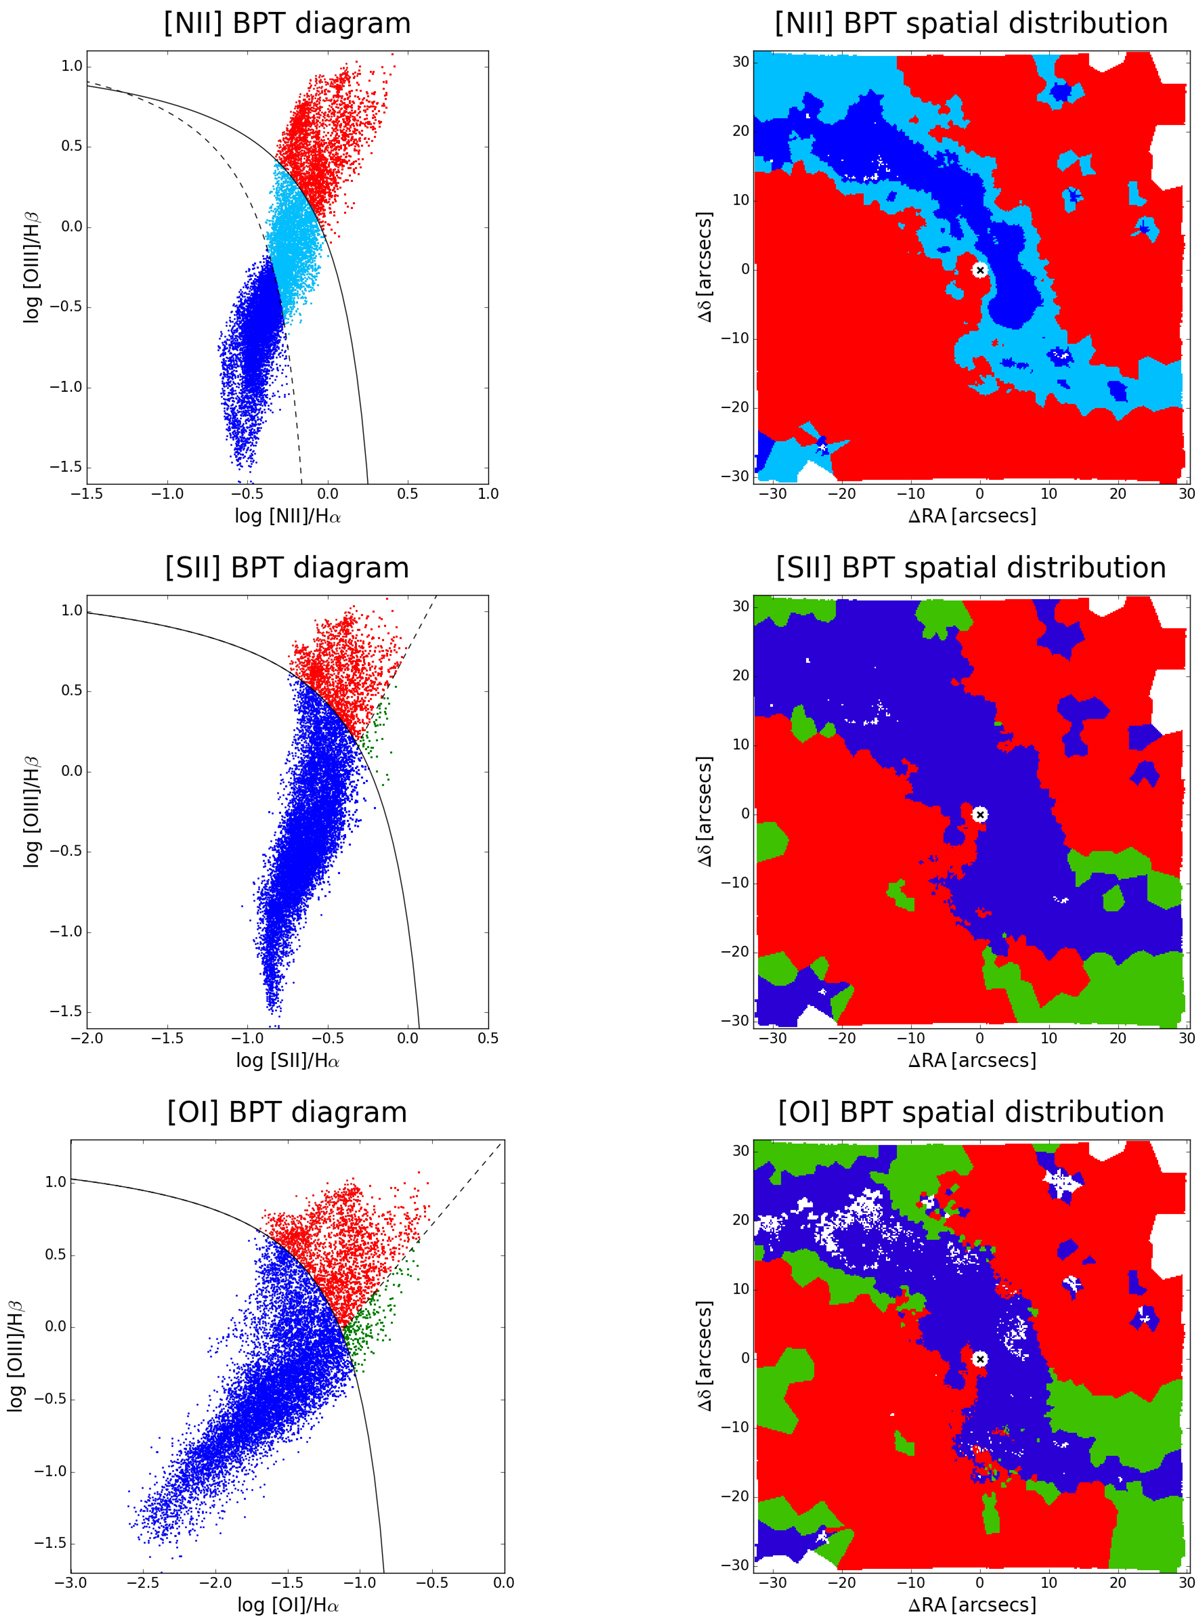
Spatially resolved BPT diagrams (left) of NGC 1365 and corresponding spatial distribution (right), obtained from the fit of the star-subtracted Voronoi-binned cube (so as to have an average signal-to-noise ratio of at least 4 per bin in each wavelength channel around Hβ). The N-BPT ([N II]λ6584/Hα vs. [O III]λ5007/Hβ, upper panels), S-BPT ([S II]λλ6716,6731/Hα vs. [O III]λ5007/Hβ, central panels), and O-BPT ([O I]λ6300/Hα vs. [O III]λ5007/Hβ, lower panels) diagrams for each bin with S/N > 3 in each line are shown on the left, while the corresponding maps are reported on the right (each bin in the maps corresponds to a single dot in the diagrams). The solid curves in the diagrams define the theoretical upper bound for pure star formation (Kewley et al. 2001), while the dashed one in the N-BPT is the Kauffmann et al. (2003) empirical classification, and all bins under this curve are star-formation dominated. Finally, the dashed line in S-BPT and O-BPT diagrams separates Seyfert galaxies from LI(N)ERs (Kewley et al. 2006). SF-dominated regions are then marked in blue, Seyfert-type ionization is displayed in red, green marks LI(N)ER regions in the S-BPT and O-BPT, while light blue denotes composite regions in the N-BPT lying between Kewley et al. (2001) and Kauffmann et al. (2003) curves. A 6px-radius circle around the center has been masked, because of BLR contamination (see text).
Current usage metrics show cumulative count of Article Views (full-text article views including HTML views, PDF and ePub downloads, according to the available data) and Abstracts Views on Vision4Press platform.
Data correspond to usage on the plateform after 2015. The current usage metrics is available 48-96 hours after online publication and is updated daily on week days.
Initial download of the metrics may take a while.