Fig. 4.
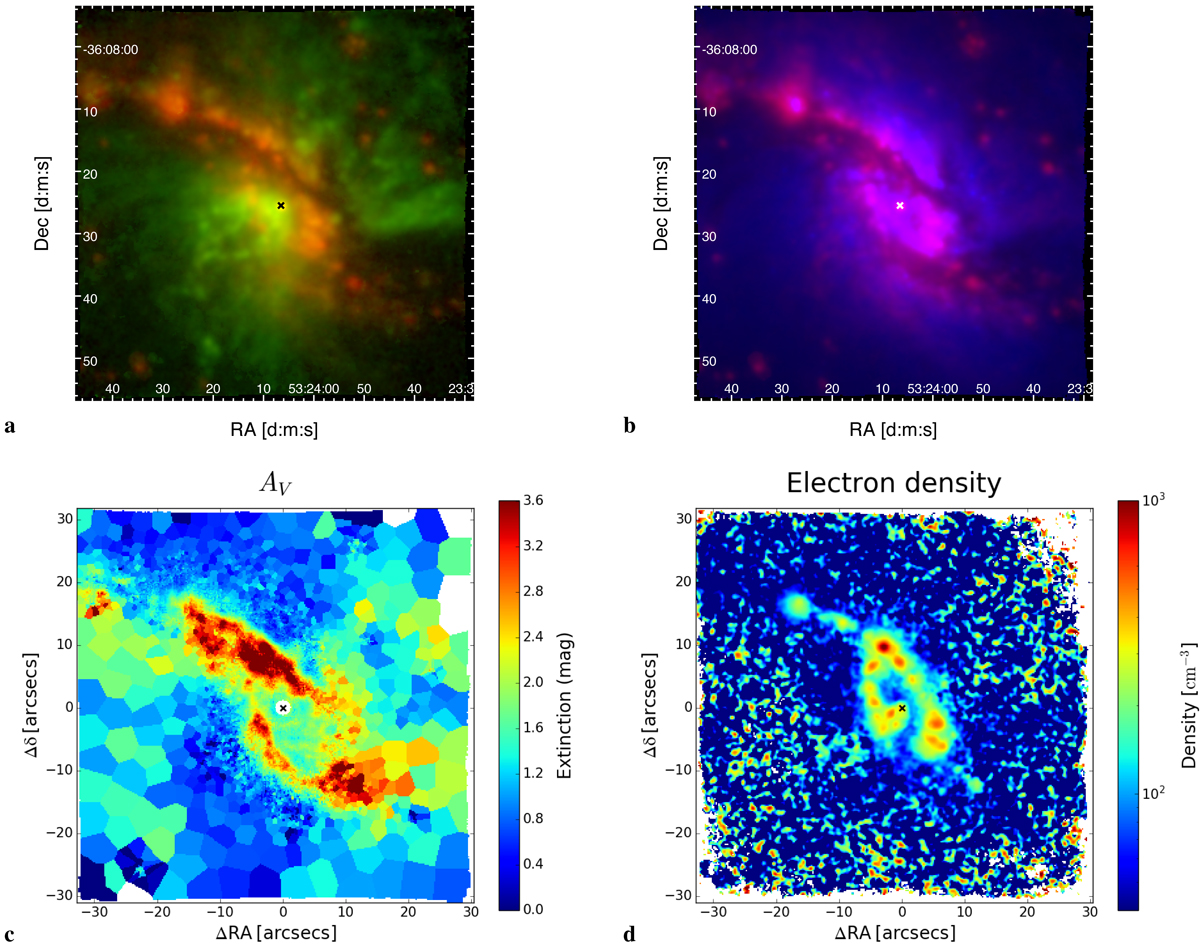
Panel a: two-color image of [O III] (green) and Hα (red), from the fit of the star-subtracted 1px-σ smoothed data cube. Panel b: two-color image of Hα emission (red) and stellar continuum between ∼5100–5800 Å (blue). Panel c: map of the total dust extinction in V band AV from the measured Balmer decrement (Hα/Hβ flux ratio), from the fit of the star-subtracted Voronoi-binned data cube (produced to have an average signal-to-noise ratio per wavelength channel around Hβ of at least 4 in each bin). Panel d: electron density from [S II] λ6716/λ6731 diagnostic line ratio (a typical value of Te = 104 K is assumed for the temperature of the gas).
Current usage metrics show cumulative count of Article Views (full-text article views including HTML views, PDF and ePub downloads, according to the available data) and Abstracts Views on Vision4Press platform.
Data correspond to usage on the plateform after 2015. The current usage metrics is available 48-96 hours after online publication and is updated daily on week days.
Initial download of the metrics may take a while.