Fig. 13.
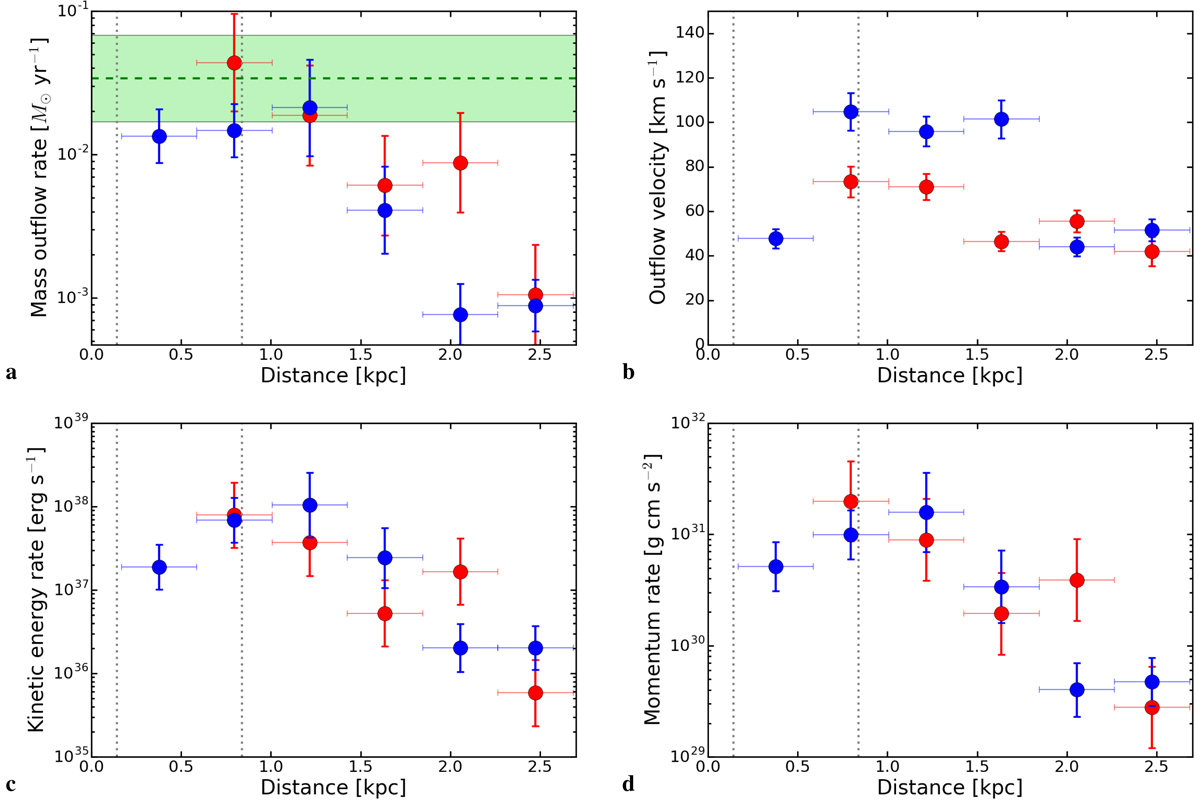
Panel a: mass outflow rate of the ionized gas as a function of distance from the active nucleus, obtained from the gridded map in Fig. 7; blue and red points indicate the sum of the mass outflow rates of all the grid elements at a certain distance, for the SE (blueshifted) cone and for the NW (redshifted) one, respectively. The error bars on the distance indicate the width of the radial shells. The green dashed line is the mass outflow rate obtained for the nuclear outflow from Fe XXV and Fe XXVI absorption lines from Chandra X-ray data (Sect. 3), together with its typical uncertainty in shaded green; the two dotted gray lines mark the scale of the inner minor semi-axis and of the outer major semi-axis of the circumnuclear SF ring, respectively. Panel b: absolute value of the outflow velocity; the points indicate the average velocity at the given distance. Panel c: kinetic energy rate radial profile. Panel d: momentum rate radial profile.
Current usage metrics show cumulative count of Article Views (full-text article views including HTML views, PDF and ePub downloads, according to the available data) and Abstracts Views on Vision4Press platform.
Data correspond to usage on the plateform after 2015. The current usage metrics is available 48-96 hours after online publication and is updated daily on week days.
Initial download of the metrics may take a while.