Fig. 1.
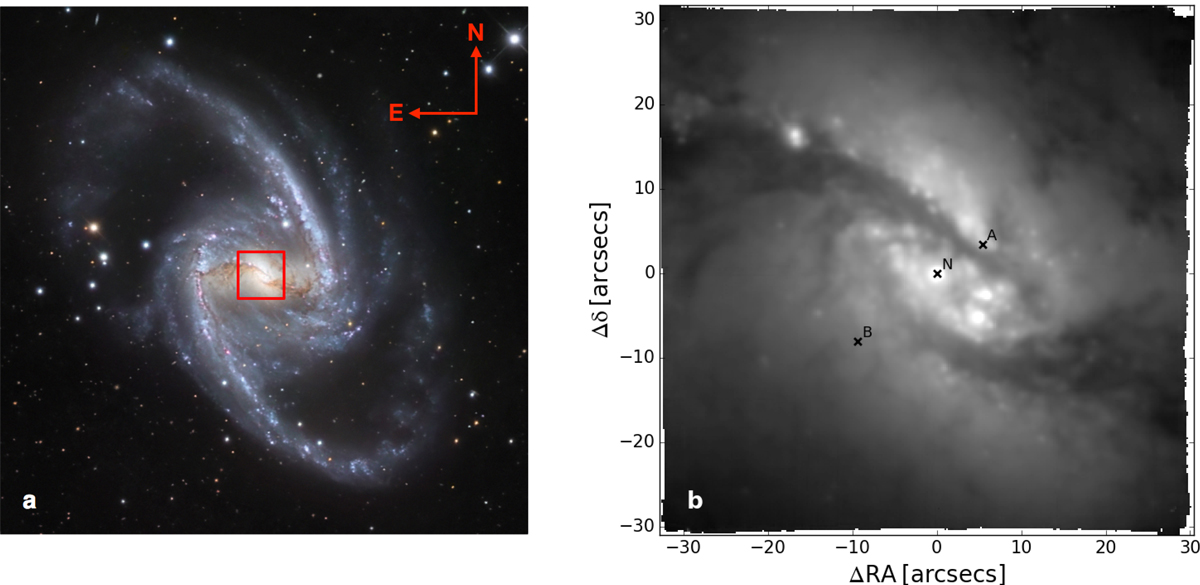
Panel a: three-color optical image of NGC 1365 combining observations performed through three different filters (B, V, R) with the 1.5-m Danish telescope at the ESO La Silla Observatory in Chile. The red box indicates the region analyzed in this work, corresponding to the MUSE FOV (∼1′ × 1′). East is to the left. Credit: ESO/IDA/Danish 1.5 m/ R. Gendler, J-E. Ovaldsen, C. Thöne, and C. Feron. Panel b: continuum emission from MUSE having collapsed the data cube in the range ∼5100–6470 Å, excluding emission lines and the sky residuals. The crosses mark the extraction regions of the spectra shown in Fig. 2.
Current usage metrics show cumulative count of Article Views (full-text article views including HTML views, PDF and ePub downloads, according to the available data) and Abstracts Views on Vision4Press platform.
Data correspond to usage on the plateform after 2015. The current usage metrics is available 48-96 hours after online publication and is updated daily on week days.
Initial download of the metrics may take a while.