Fig. A.2.
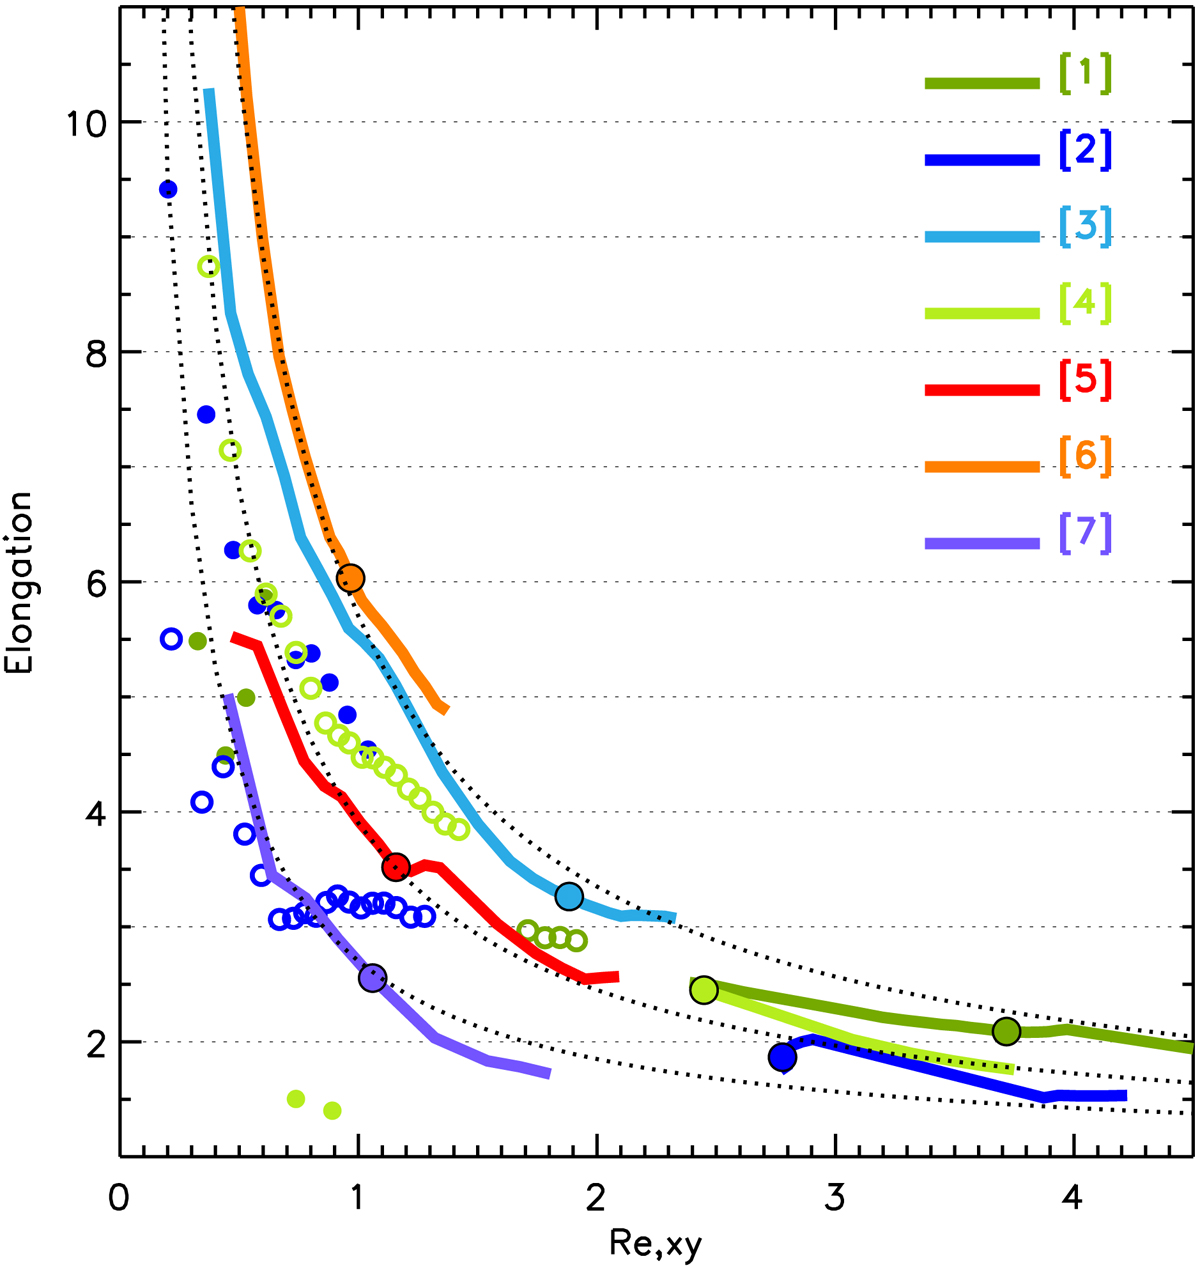
Elongation Ez/xy as a function of Re,xy. The different colours refer to the different peaks as in the legend. Ez/xy and Re,xy are measured by fixing different thresholds (number of σδ above the mean density) to define the peaks themselves, ranging from 4.1 to 7σδ. Ez/xy and Re,xy measured at the 5σδ threshold are highlighted with a filled circle, and are the same quoted in Table 2. The peaks [1] and [2] are split into two smaller peaks when δgal is above 5.5σδ and 5.7σδ above the mean density, respectively: this is shown in the plot by splitting the curve of the two peaks into two series of circles (filled and empty). The three dotted lines corresponds to the curves y = 1 + A/x, with A = 4.3, 2.9, 1.5 from top to bottom. The values of A are chosen to make the curves overlap with some of the data, to guide the eye.
Current usage metrics show cumulative count of Article Views (full-text article views including HTML views, PDF and ePub downloads, according to the available data) and Abstracts Views on Vision4Press platform.
Data correspond to usage on the plateform after 2015. The current usage metrics is available 48-96 hours after online publication and is updated daily on week days.
Initial download of the metrics may take a while.