Fig. A.1.

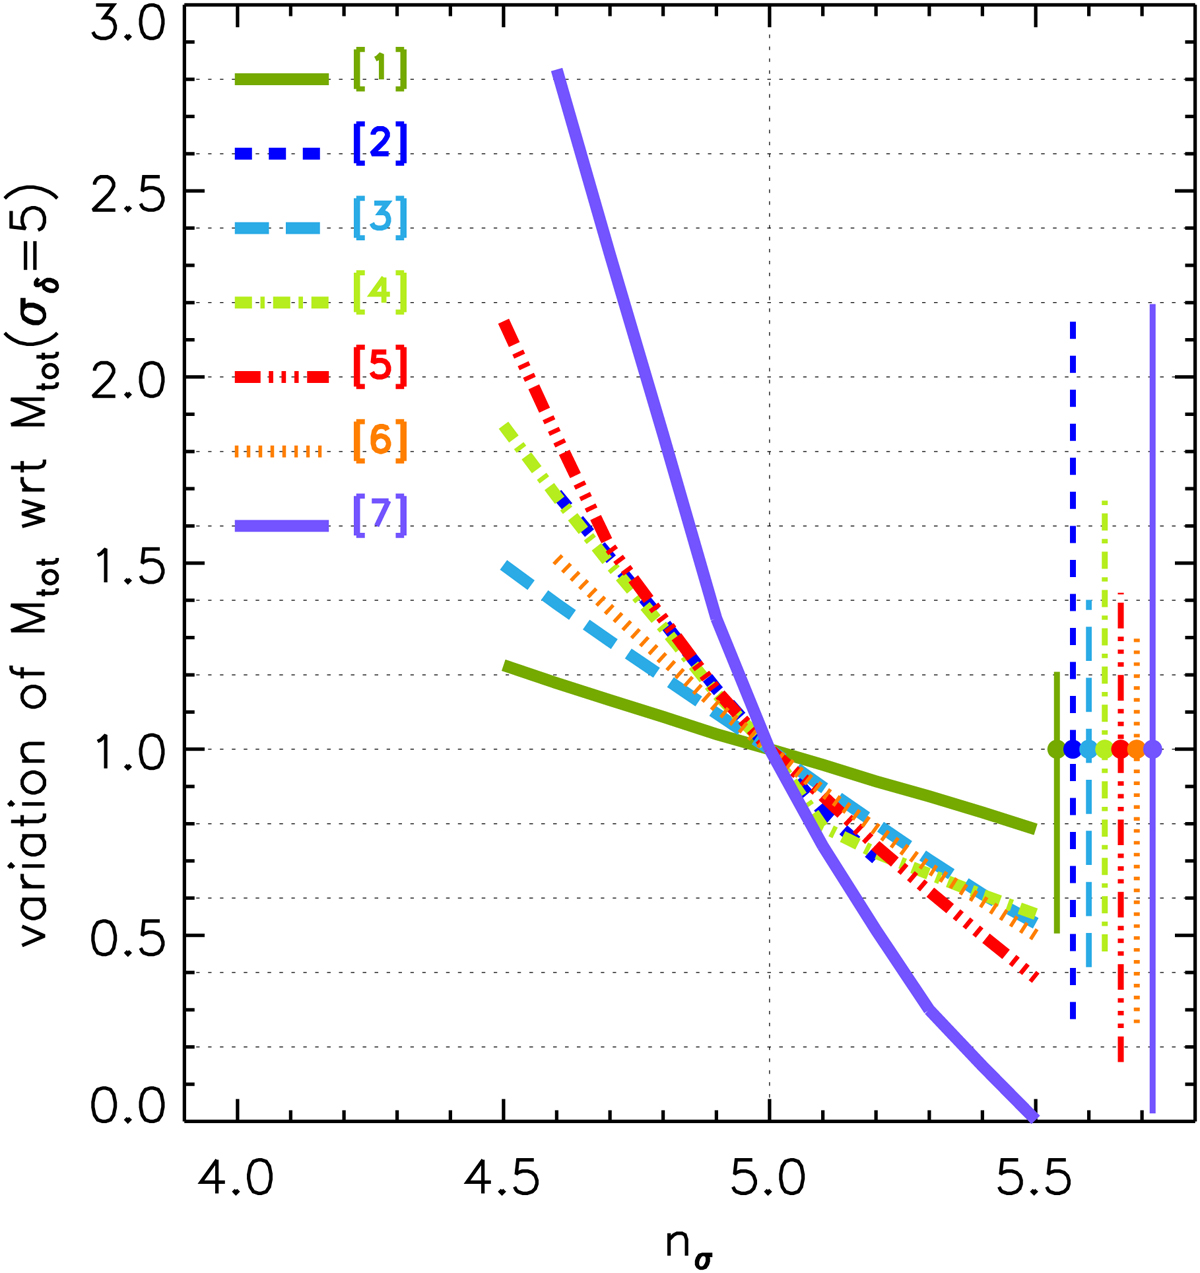
Fractional variation of the total mass Mtot (Table 1) for the seven peaks as a function of the overdensity threshold adopted to identify them, expressed in terms of the corresponding multiples nσ of σδ. The reference total mass value is the one at the 5σδ threshold. The different lines correspond to the different peaks as in the legend. The filled symbols on the right, with their error bars, correspond to the fractional variation of Mtot calculated at 5σδ resulting from the uncertainties on the density reconstruction quoted in Table 1. The position of the error bars on the x-axis is arbitrary. In all cases, these errors are much larger than the uncertainty resulting from slightly modulating the overdensity threshold employed.
Current usage metrics show cumulative count of Article Views (full-text article views including HTML views, PDF and ePub downloads, according to the available data) and Abstracts Views on Vision4Press platform.
Data correspond to usage on the plateform after 2015. The current usage metrics is available 48-96 hours after online publication and is updated daily on week days.
Initial download of the metrics may take a while.


