Fig. 7.
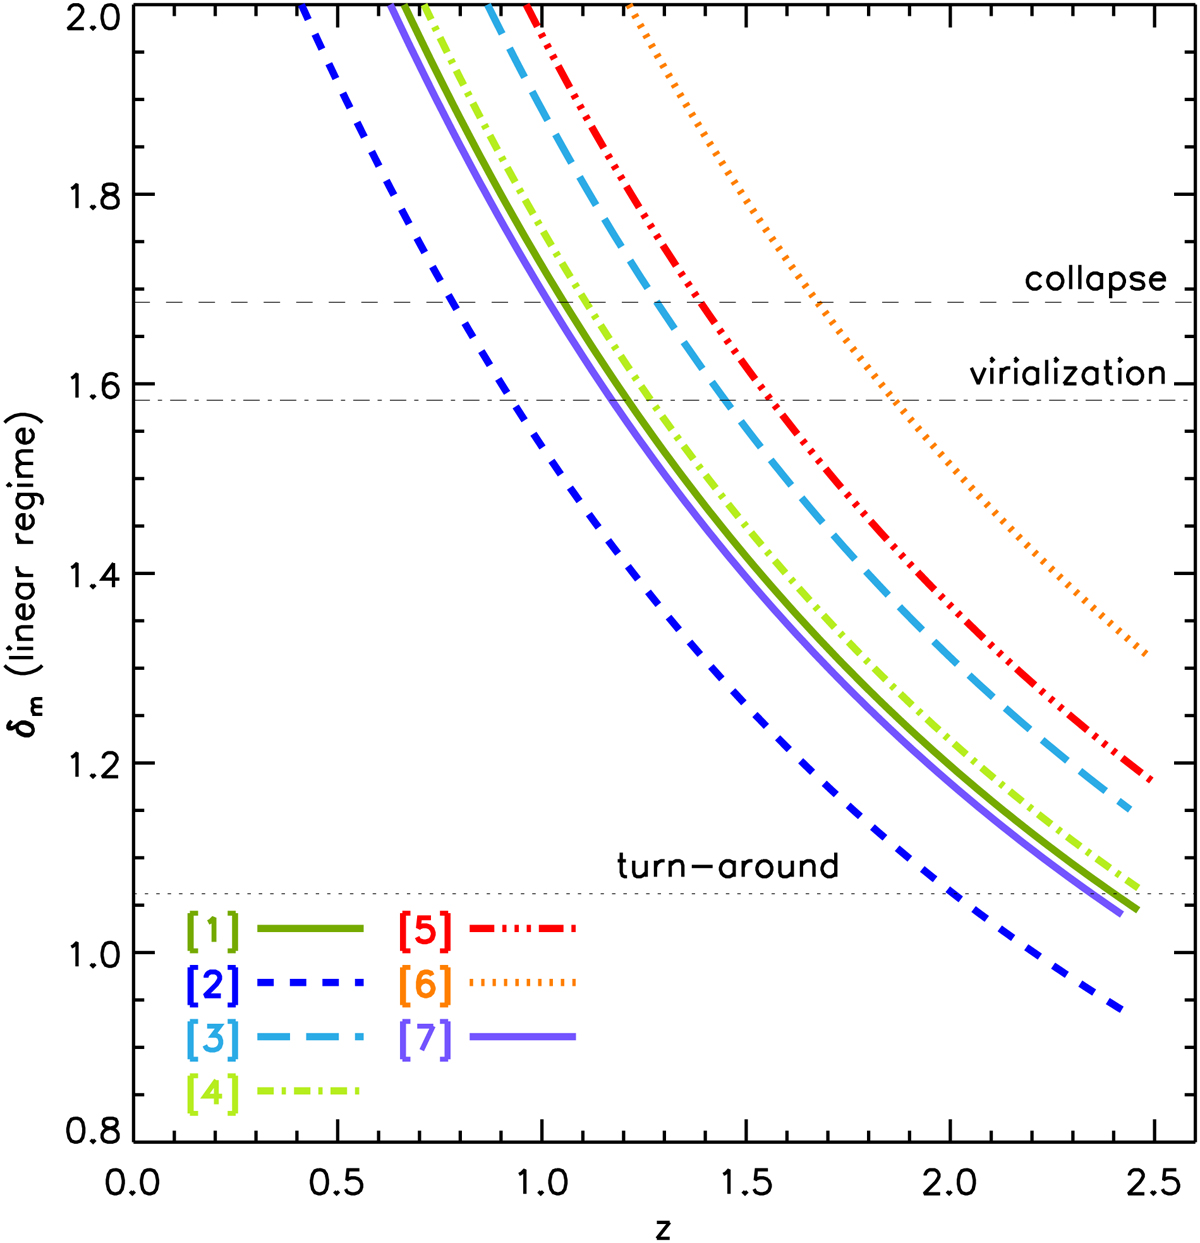
Evolution of δm for the seven peaks listed in Table 5, with different line styles as in the legend. The evolution is computed in a linear regime for a ΛCDM Universe. For each peak, we start tracking the evolution from the redshift of observation (Col. 2 in Table 5), and we consider as starting δm the one computed from the corrected ⟨δgal,corr⟩ (Col. 7 in Table 2) and transformed into linear regime. The horizontal lines represent δL,ta ≃ 1.062, δL, vir ≃ 1.58 and δL,c ≃ 1.686. See Sect. 5.1 for more details.
Current usage metrics show cumulative count of Article Views (full-text article views including HTML views, PDF and ePub downloads, according to the available data) and Abstracts Views on Vision4Press platform.
Data correspond to usage on the plateform after 2015. The current usage metrics is available 48-96 hours after online publication and is updated daily on week days.
Initial download of the metrics may take a while.