Fig. 6.
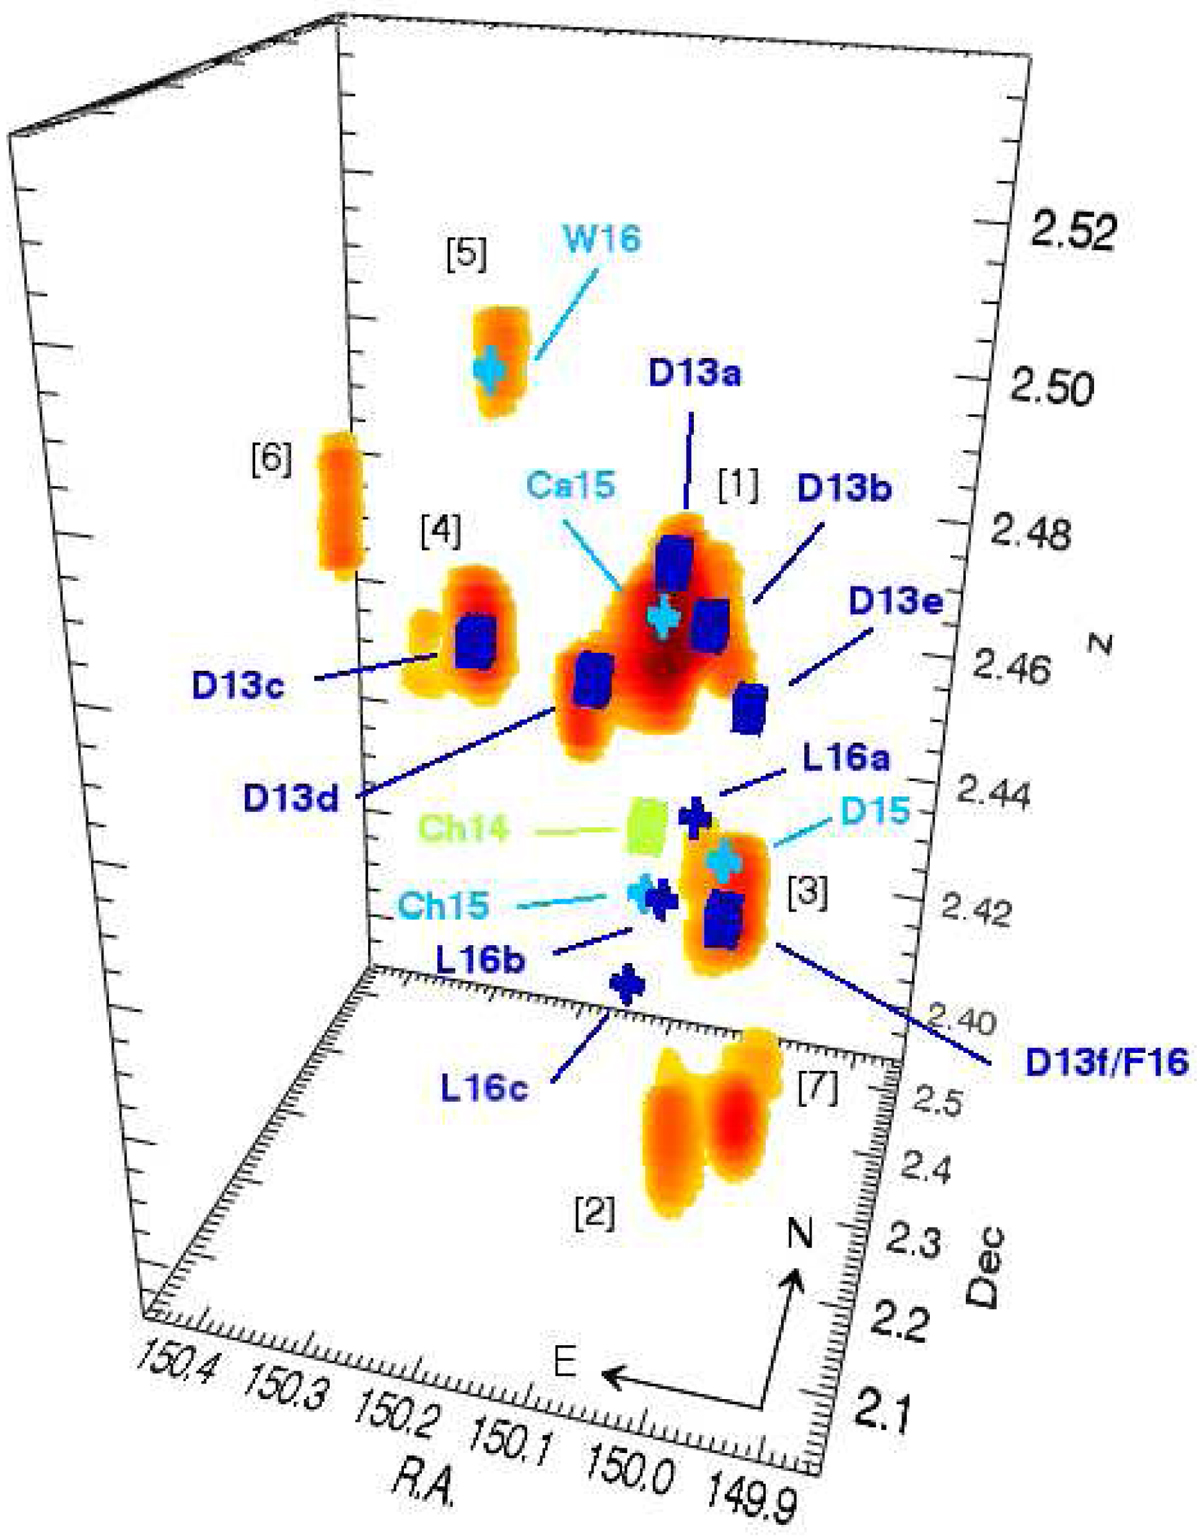
Same as Fig. 3, but in RA–Dec–z coordinates. Moreover, we overplot the location of the overdensity peaks/proto-clusters/proto-groups detected in other works in the literature (blue and green cubes, and blue and cyan crosses). Different colours and shapes are used for the symbols for clarity purposes only. Labels correspond to the IDs in Table 4. The dimensions of the symbols are arbitrary and do not refer to the extension of the overdensity peaks found in the literature.
Current usage metrics show cumulative count of Article Views (full-text article views including HTML views, PDF and ePub downloads, according to the available data) and Abstracts Views on Vision4Press platform.
Data correspond to usage on the plateform after 2015. The current usage metrics is available 48-96 hours after online publication and is updated daily on week days.
Initial download of the metrics may take a while.