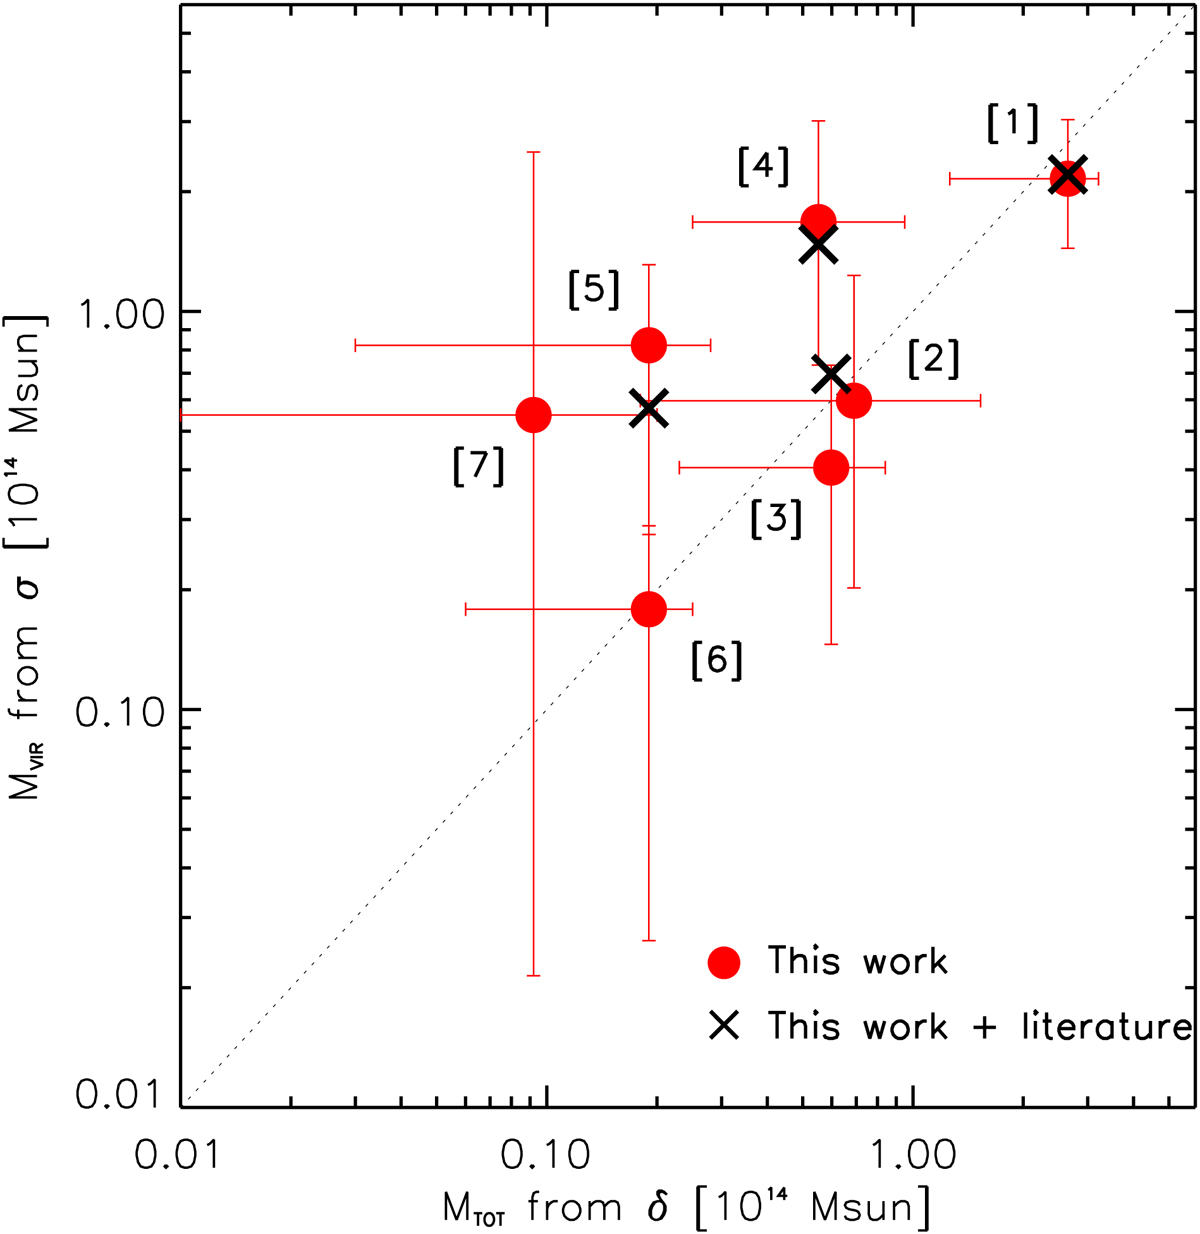
Fig. 5.

Virial mass Mvir of the seven identified peaks, as in Table 3, vs. the total mass Mtot as in Table 1. We show both the virial mass computed only with our spectroscopic sample (red dots, Col. 6 of Table 3) and how it would change if we add to our sample other spectroscopic sources found in the literature (black crosses, Col. 9 of Table 3). Only peaks [1], [3], [4], and [5] have this second estimate of Mvir. The dotted line is the bisector, as a reference.
Current usage metrics show cumulative count of Article Views (full-text article views including HTML views, PDF and ePub downloads, according to the available data) and Abstracts Views on Vision4Press platform.
Data correspond to usage on the plateform after 2015. The current usage metrics is available 48-96 hours after online publication and is updated daily on week days.
Initial download of the metrics may take a while.


