Fig. 4.
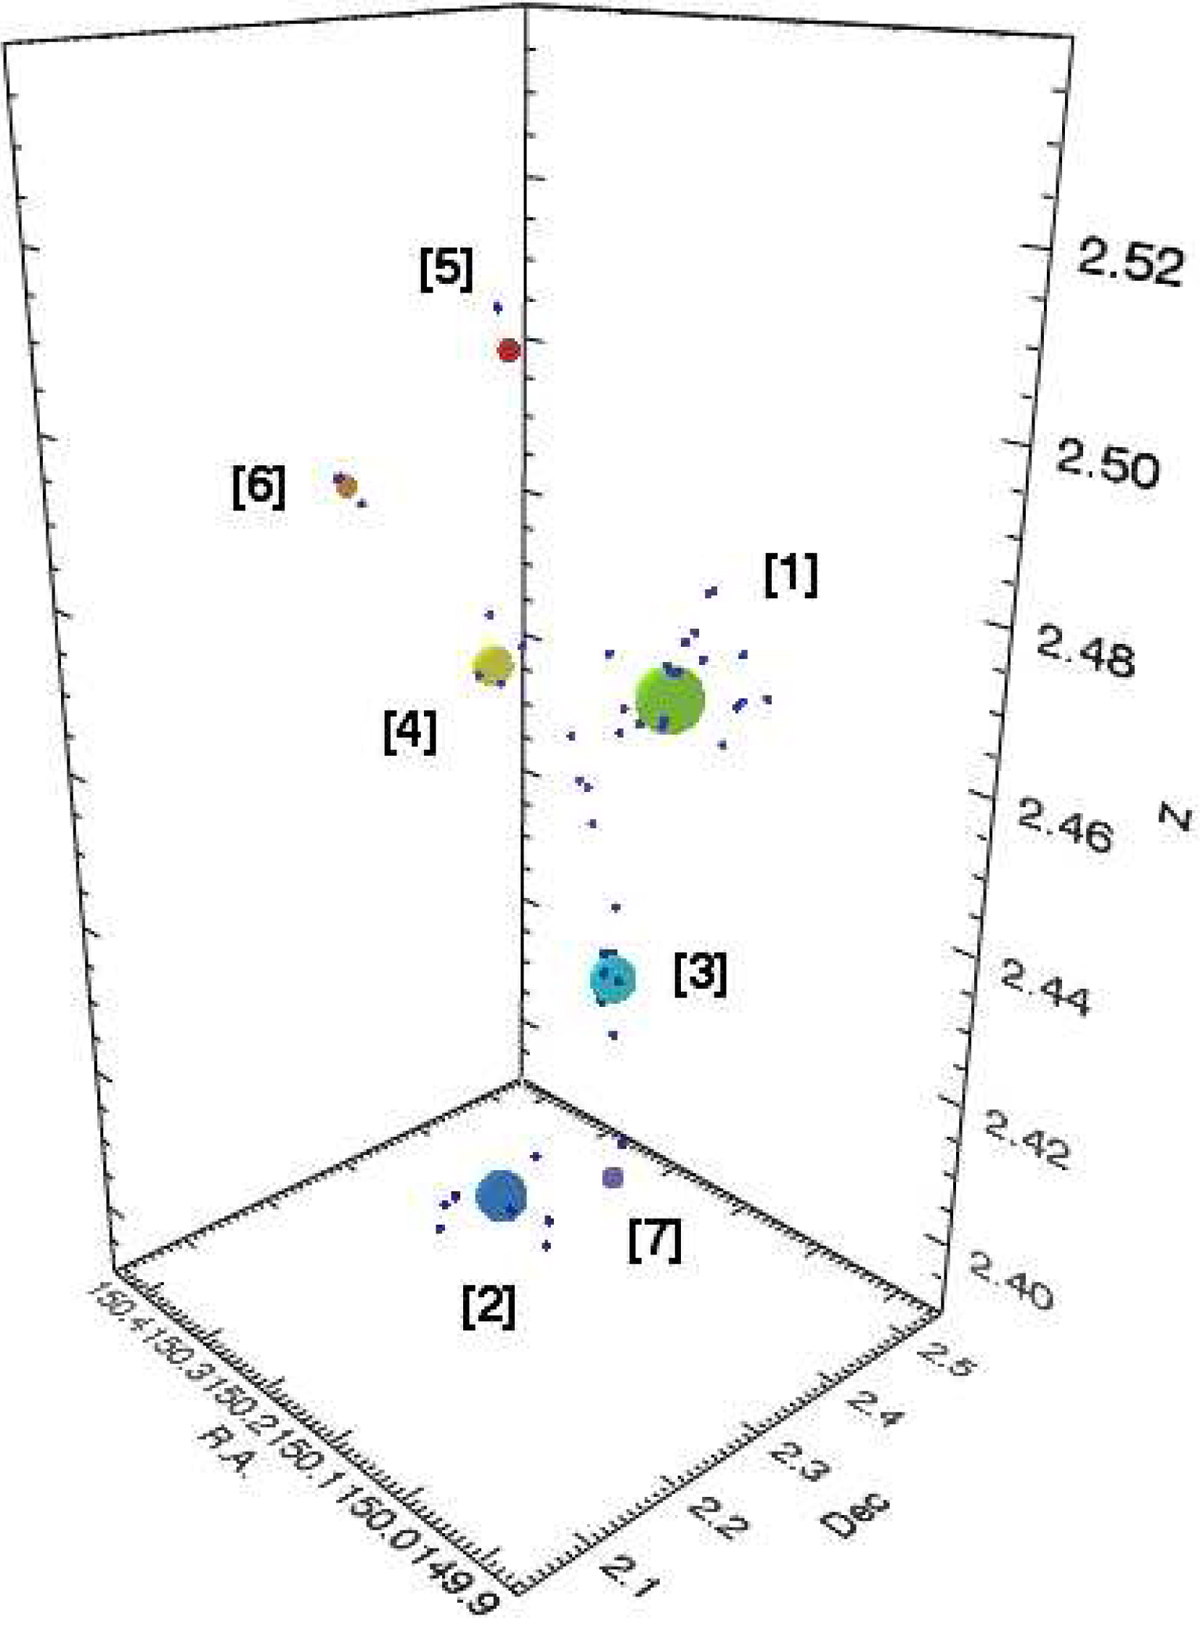
Same volume of space as Fig. 3, but in RA–Dec–z coordinates. Each sphere represents one of the overdensity peaks, and is placed at its barycenter (see Table 1). The colour of the spheres scales with redshift (blue = low z, dark red = high z), and the dimension scales with the logarithm of Mtot quoted in Table 1. Small blue dots are the spectroscopic galaxies which are members of each overdensity peak, as described in Sect. 4.
Current usage metrics show cumulative count of Article Views (full-text article views including HTML views, PDF and ePub downloads, according to the available data) and Abstracts Views on Vision4Press platform.
Data correspond to usage on the plateform after 2015. The current usage metrics is available 48-96 hours after online publication and is updated daily on week days.
Initial download of the metrics may take a while.