Fig. 2.
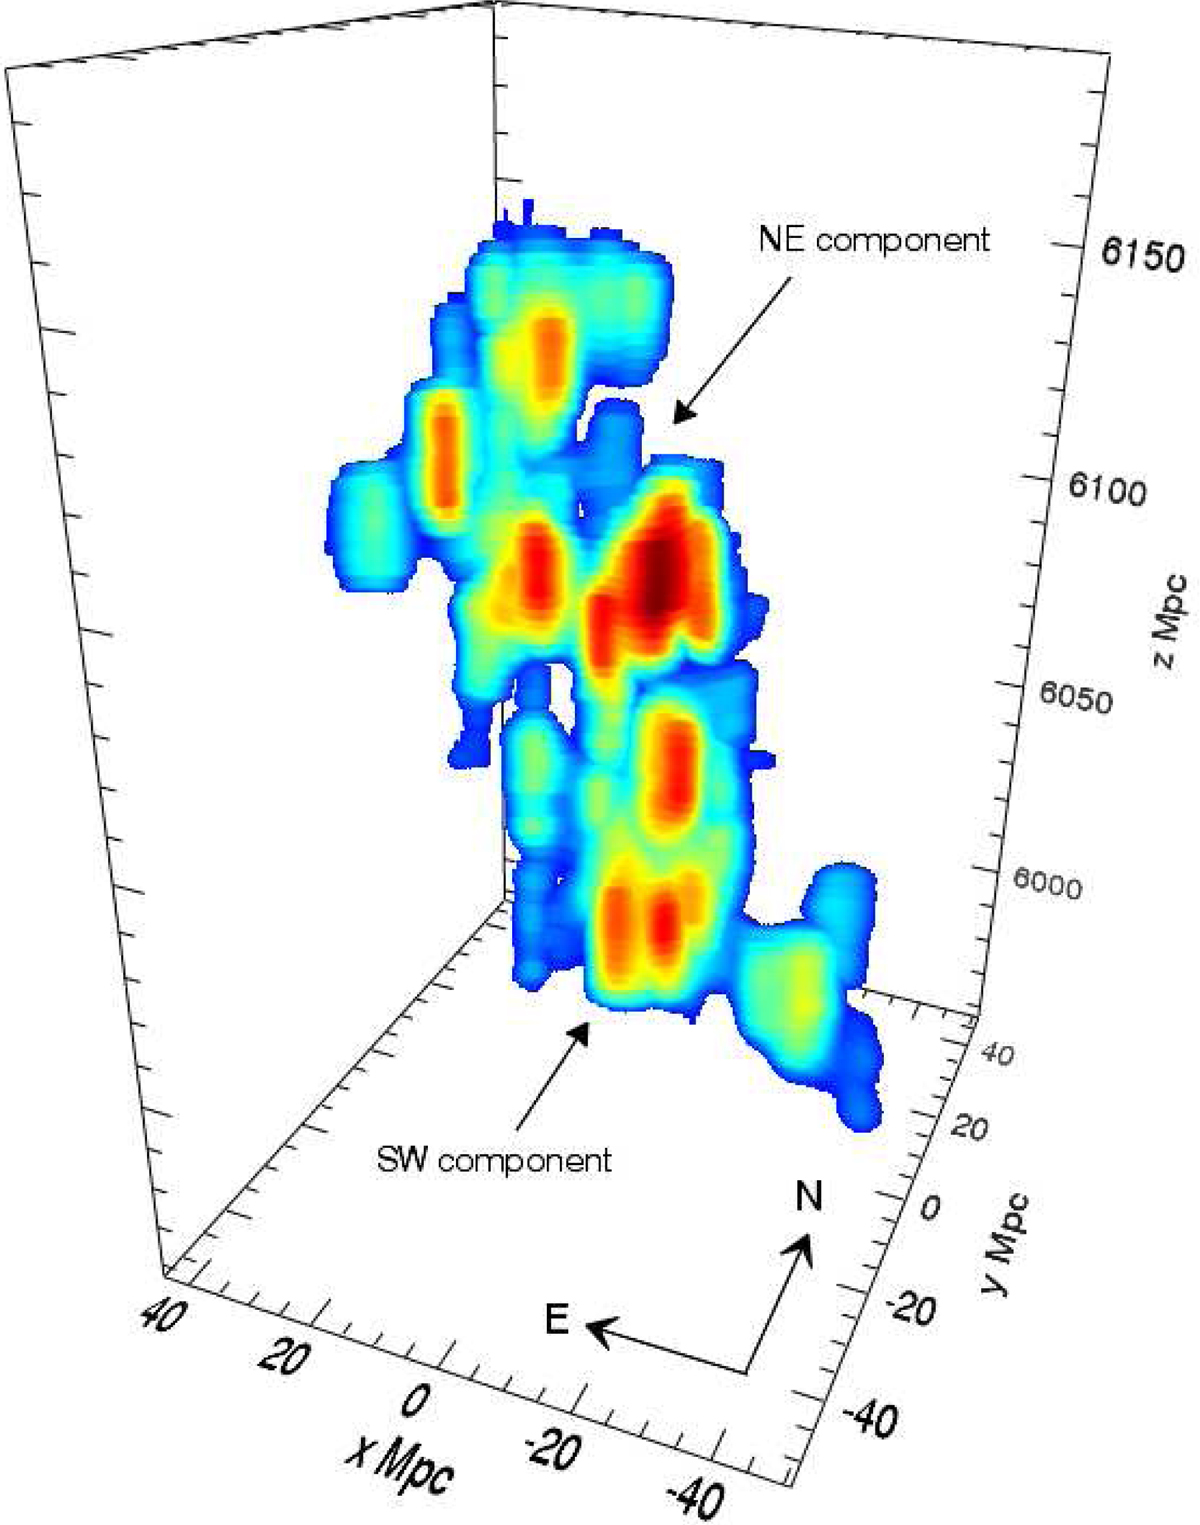
3D overdensity map of the Hyperion proto-supercluster, in comoving megaparsecs. Colours scale with log(σδ), exactly as in Fig. 1, from blue (2σδ) to the darkest red (∼8.3σδ, the highest measured value in our 3D cube). The x−, y− and z−axes span the ranges 149.6 ≤ RA ≤ 150.52, 1.74 ≤ Dec ≤ 2.73 and 2.35 ≤ z ≤ 2.55. The NE and SW components are indicated. We highlight the fact that this figure shows only the proto-supercluster, and omits other less extended and less dense density peaks which fall in the plotted volume (see discussion in Sect. 3.2.).
Current usage metrics show cumulative count of Article Views (full-text article views including HTML views, PDF and ePub downloads, according to the available data) and Abstracts Views on Vision4Press platform.
Data correspond to usage on the plateform after 2015. The current usage metrics is available 48-96 hours after online publication and is updated daily on week days.
Initial download of the metrics may take a while.