Fig. B.1.
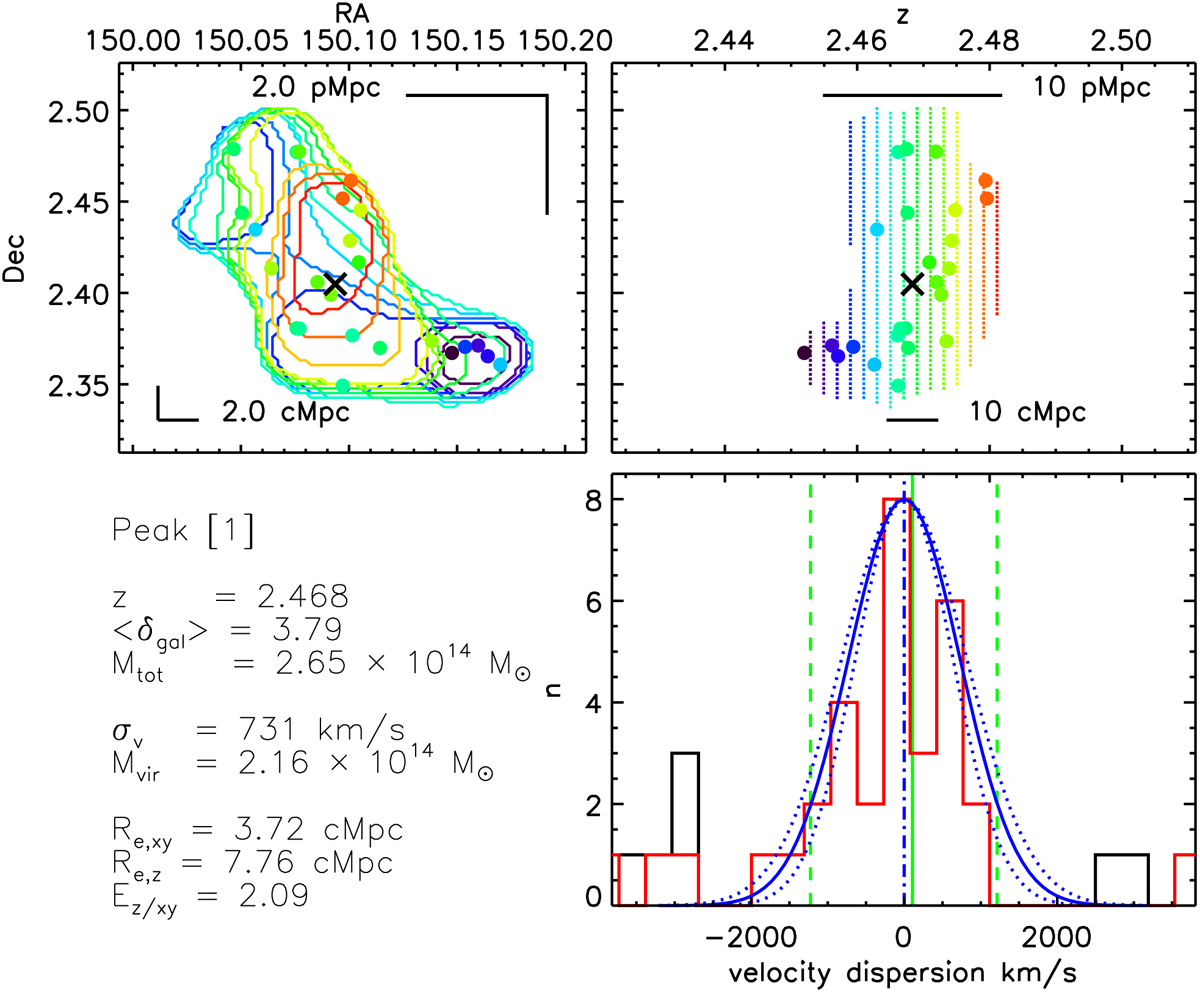
For peak [1], “Theia”, top-left panel: projection on the RA–Dec plane of the 5σδ contours which identify the peak in the 3D overdensity cube; the different colours indicate the different redshift slices (from blue to red, they go from the lowest to the highest redshift). Filled circles are the spectroscopic galaxies which are members of the peak (flag = X2/X2.5, X3, X4, X9), with the same colour code as the contours. The black cross is the RA–Dec barycenter of the peak. In the top-right and bottom-left corners we show the scale in pMpc and cMpc, respectively, for both RA and Dec. Top-right: projections on the z-Dec plane of the same contours shown in the top-left panel, with the same colour code. The filled circles and the black cross are as in the top-left panel. On the top and on the bottom of the panel we show the scale in pMpc and cMpc, respectively. Bottom-right: black histogram represents the velocity distribution of the spectroscopic galaxies which fall in the same RA–Dec region as the proto-cluster. The red histogram includes only VUDS and zCOSMOS galaxies with reliable quality flag, and flags X1/X1.5 for galaxies within the peak volume (see Sect. 4.1 for details). The vertical solid green line indicates the barycenter along the l.o.s (the top x-axis is the same as the one in the top-right panel), and the two dashed vertical lines the maximum extent of the peak. The dotted-dashed blue vertical line is the zBI of Table 3, around which we center the Gaussian (blue solid curve) with the same σv as in Table 3. The two dotted blue curves are the uncertainties on the Gaussian due to the uncertainties on σv. In the bottom-left corner of the figure we summarise some of the peak properties, which are all already mentioned in the tables or in the text.
Current usage metrics show cumulative count of Article Views (full-text article views including HTML views, PDF and ePub downloads, according to the available data) and Abstracts Views on Vision4Press platform.
Data correspond to usage on the plateform after 2015. The current usage metrics is available 48-96 hours after online publication and is updated daily on week days.
Initial download of the metrics may take a while.