Fig. 4.
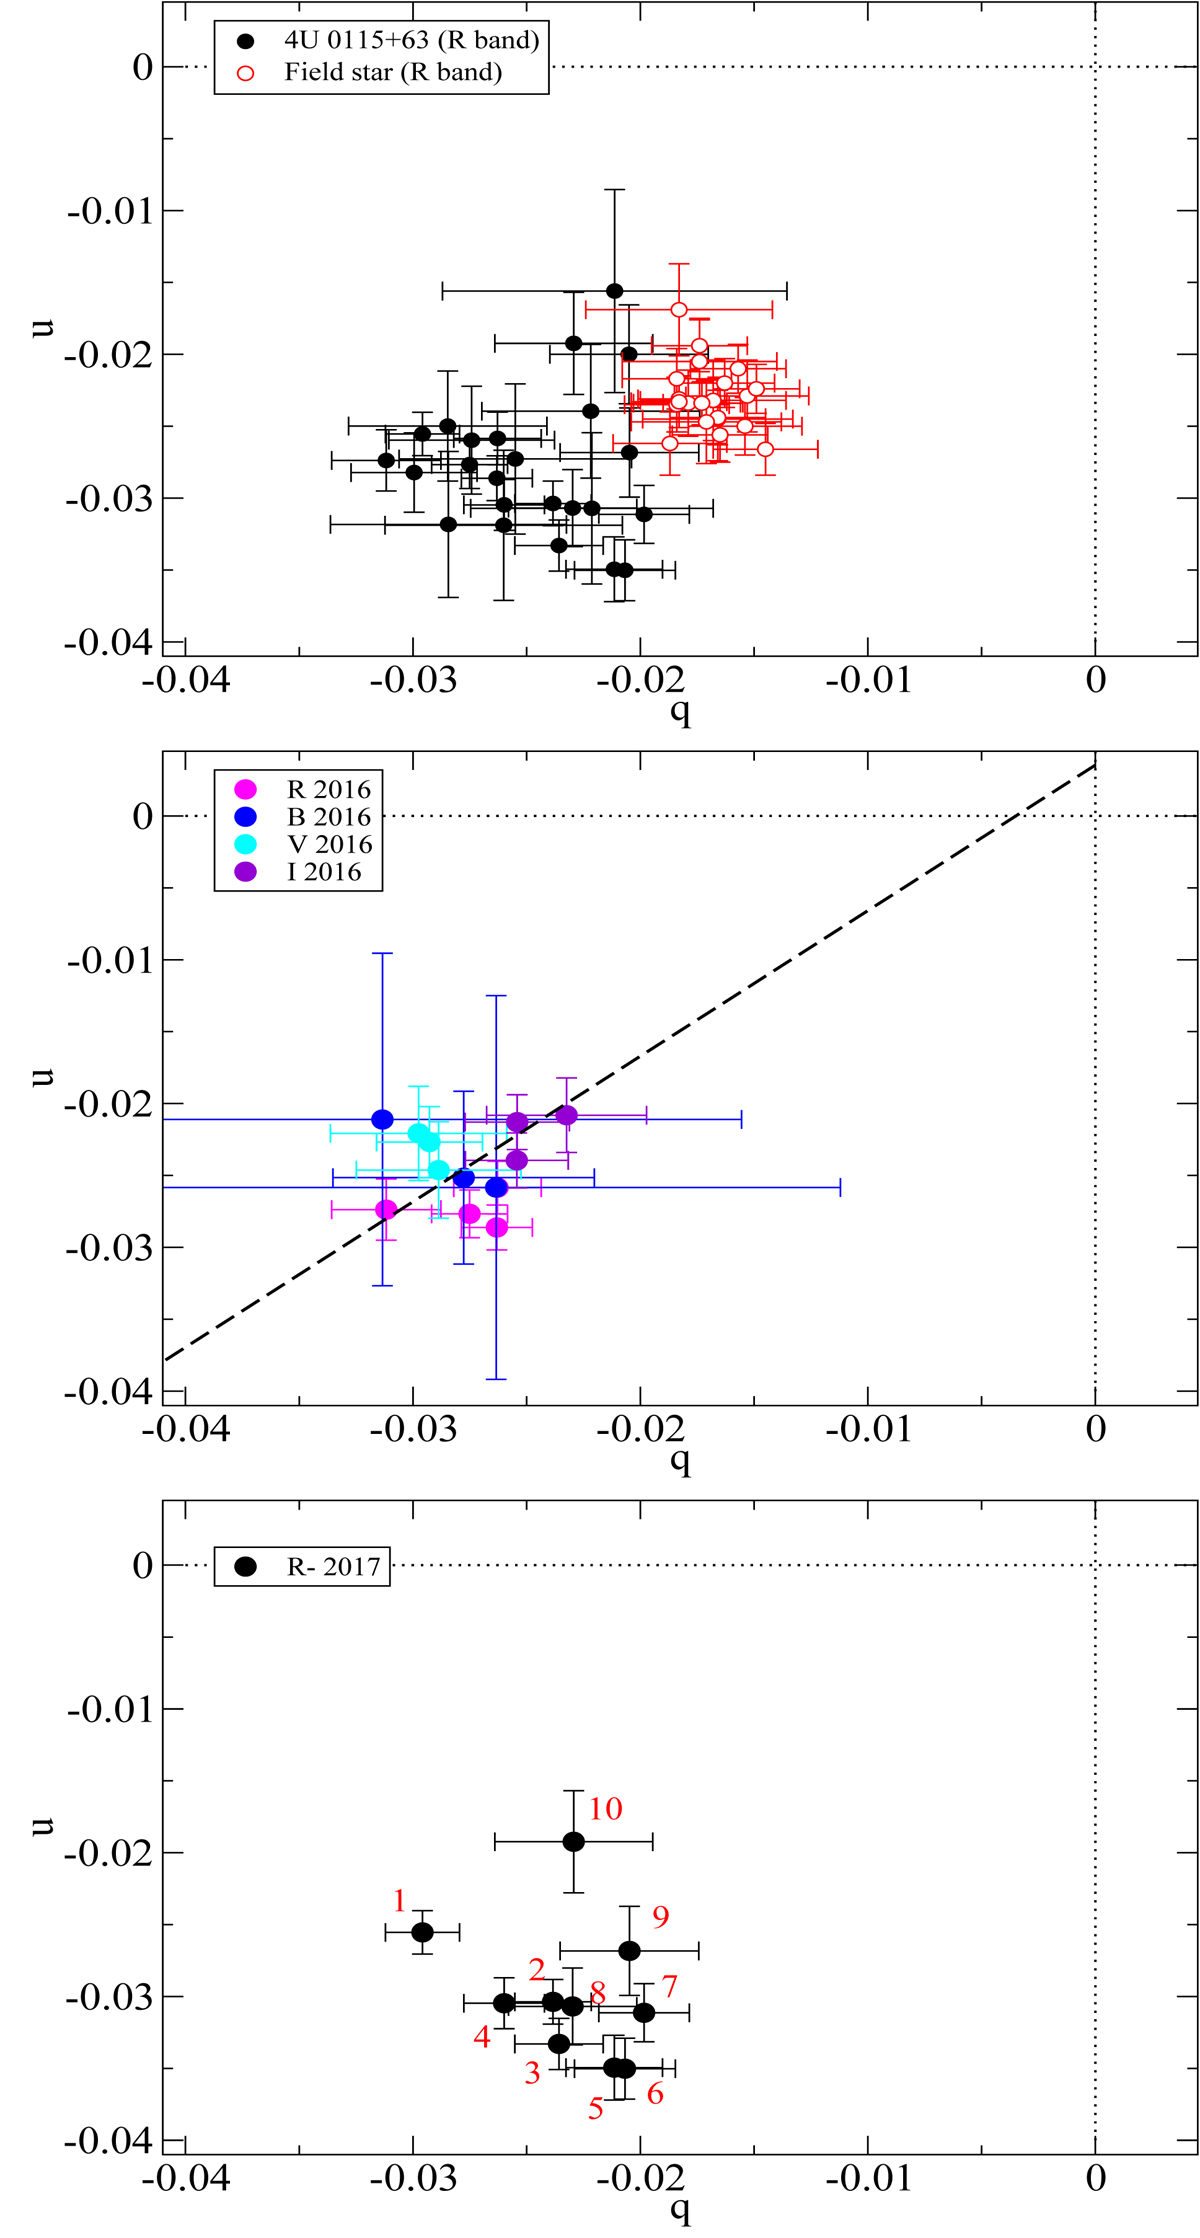
Normalized Stokes parameter diagram. Top panel: the source (black filled circles) and a field star (empty red circles) for observations spanning the period 2013–2017. Middle panel: source observations during 2016 (no X-ray outburst). Bottom panel: source observations during the 2017 outburst. The numbers indicate the flow of time, where number 1 corresponds to the older observation.
Current usage metrics show cumulative count of Article Views (full-text article views including HTML views, PDF and ePub downloads, according to the available data) and Abstracts Views on Vision4Press platform.
Data correspond to usage on the plateform after 2015. The current usage metrics is available 48-96 hours after online publication and is updated daily on week days.
Initial download of the metrics may take a while.