Fig. 5.
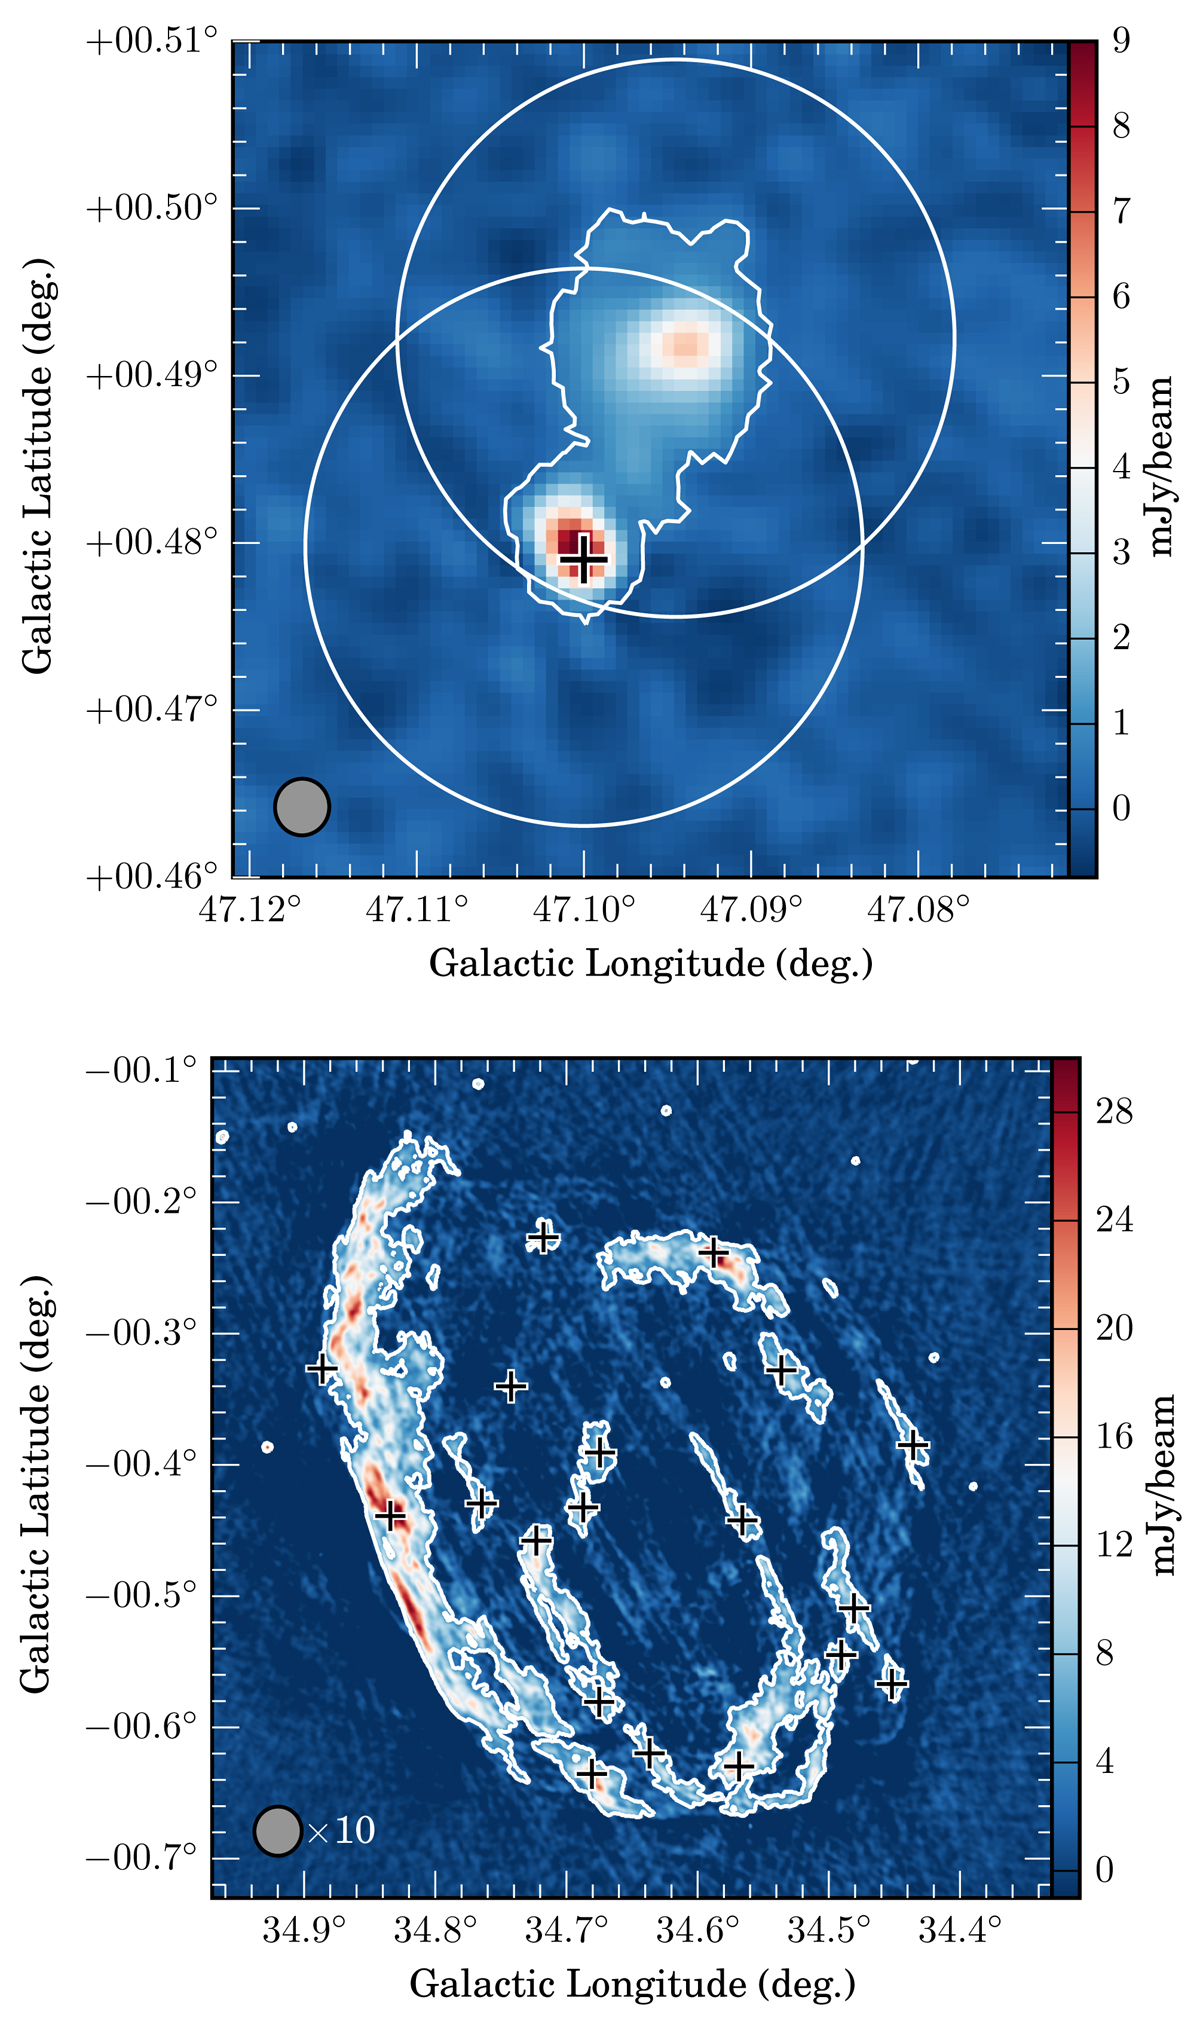
Examples of source identification in the catalog. In both panels, the white contours represent the area of the source extracted by BLOBCAT overlaid on the averaged image of spw-1440 and spw-1820, and the crosses denote the sources in the catalog. Top panel: source G47.100+0.479 consists of 2 H II regions (indicated with white circles, Anderson et al. 2014) close together. Bottom panel: the SNR W44 (e.g., Green 2014) is resolved into 19 sources in our catalog. The synthesized beam is shown in the bottom left corner of each panel. The beam in the right panel is scaled up to 10 times its original size.
Current usage metrics show cumulative count of Article Views (full-text article views including HTML views, PDF and ePub downloads, according to the available data) and Abstracts Views on Vision4Press platform.
Data correspond to usage on the plateform after 2015. The current usage metrics is available 48-96 hours after online publication and is updated daily on week days.
Initial download of the metrics may take a while.