Fig. 4.
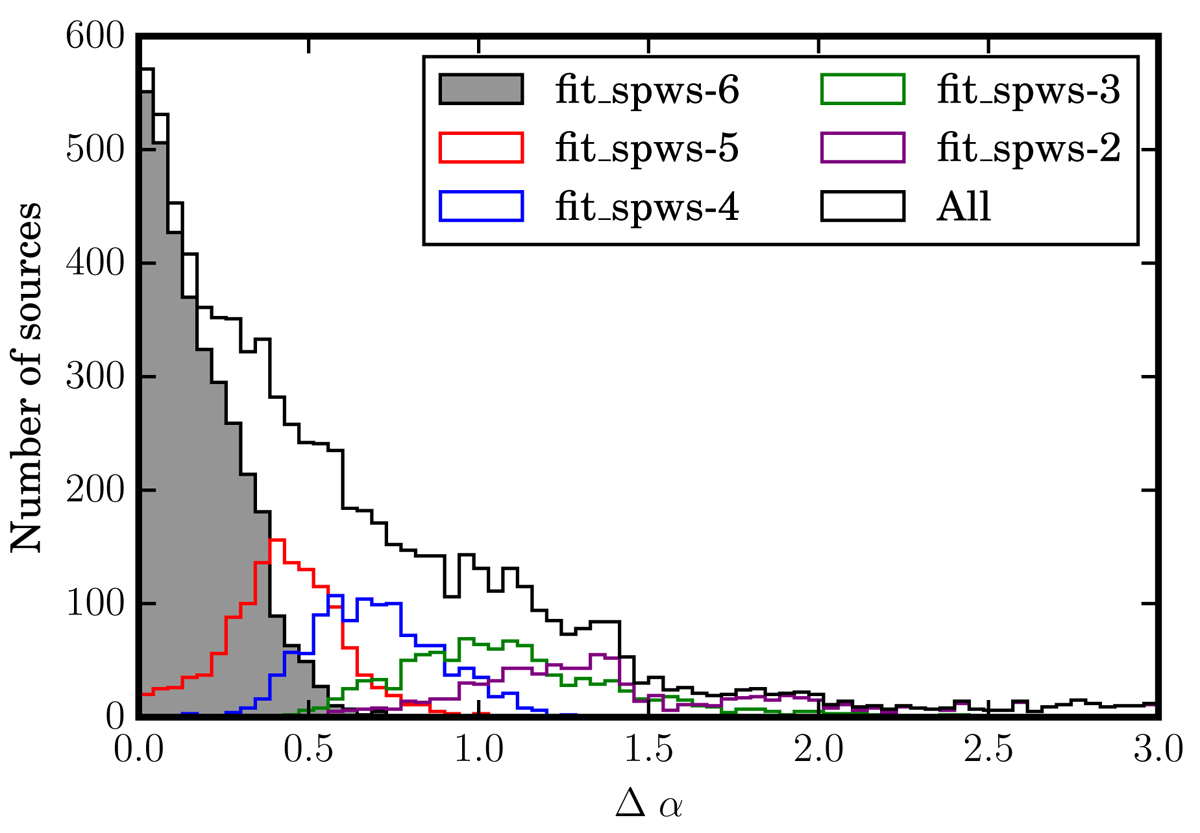
Histogram of the uncertainties of the determined spectral indices. The black line includes all sources for which we are able to determine a spectral index; the gray shaded area represents the sources for which we have an intensity measurement in all 6 SPWs, and therefore the spectral index α is derived from fitting all 6 SPWs; the red line includes sources fitted with 5 SPWs; the blue line includes sources fitted with 4 SPWs; the green line includes sources fitted with 3 SPWs; and the purple line includes sources fitted with 2 SPWs.
Current usage metrics show cumulative count of Article Views (full-text article views including HTML views, PDF and ePub downloads, according to the available data) and Abstracts Views on Vision4Press platform.
Data correspond to usage on the plateform after 2015. The current usage metrics is available 48-96 hours after online publication and is updated daily on week days.
Initial download of the metrics may take a while.