Fig. 2.
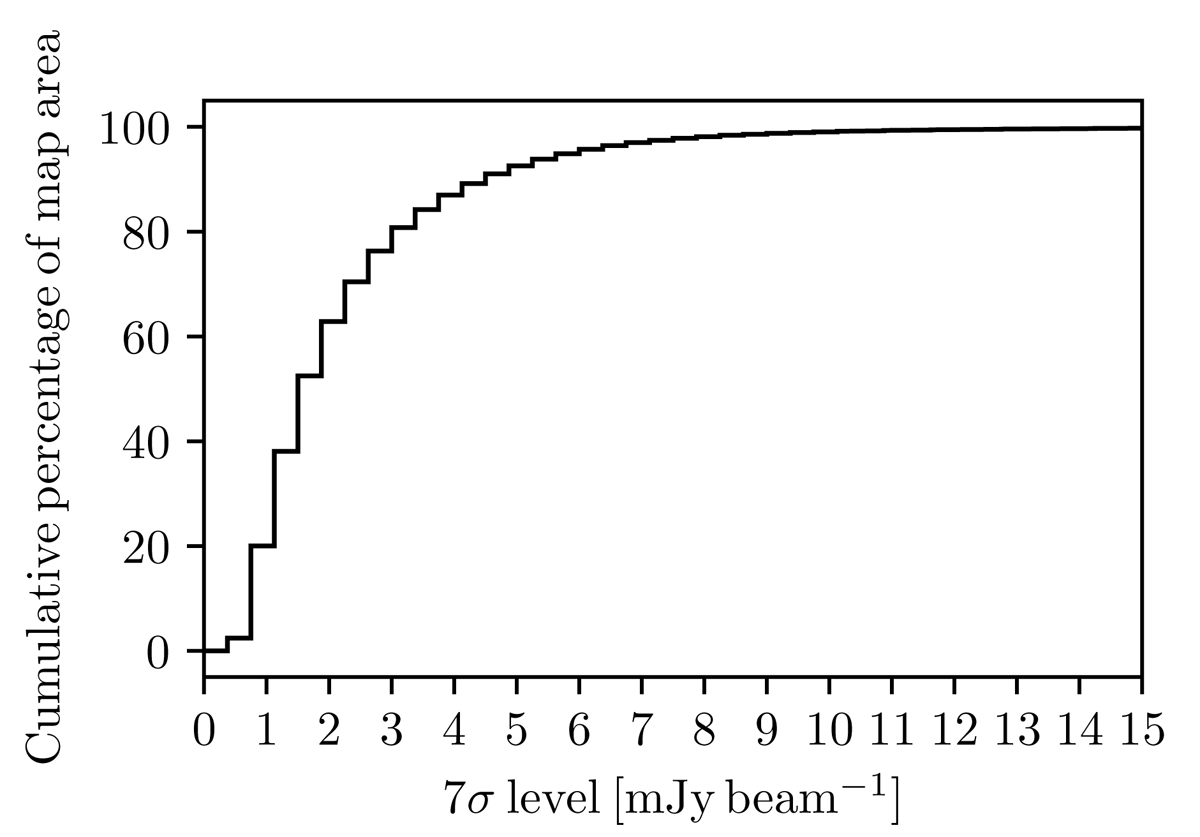
Cumulative percentage noise level diagram. The percentage of the map area as a function of the noise level at a S/N of 7σ in mJy beam−1. More than 60% of the survey area has a noise level of 7σ ≲ 2 mJy beam−1.
Current usage metrics show cumulative count of Article Views (full-text article views including HTML views, PDF and ePub downloads, according to the available data) and Abstracts Views on Vision4Press platform.
Data correspond to usage on the plateform after 2015. The current usage metrics is available 48-96 hours after online publication and is updated daily on week days.
Initial download of the metrics may take a while.