Fig. 15.
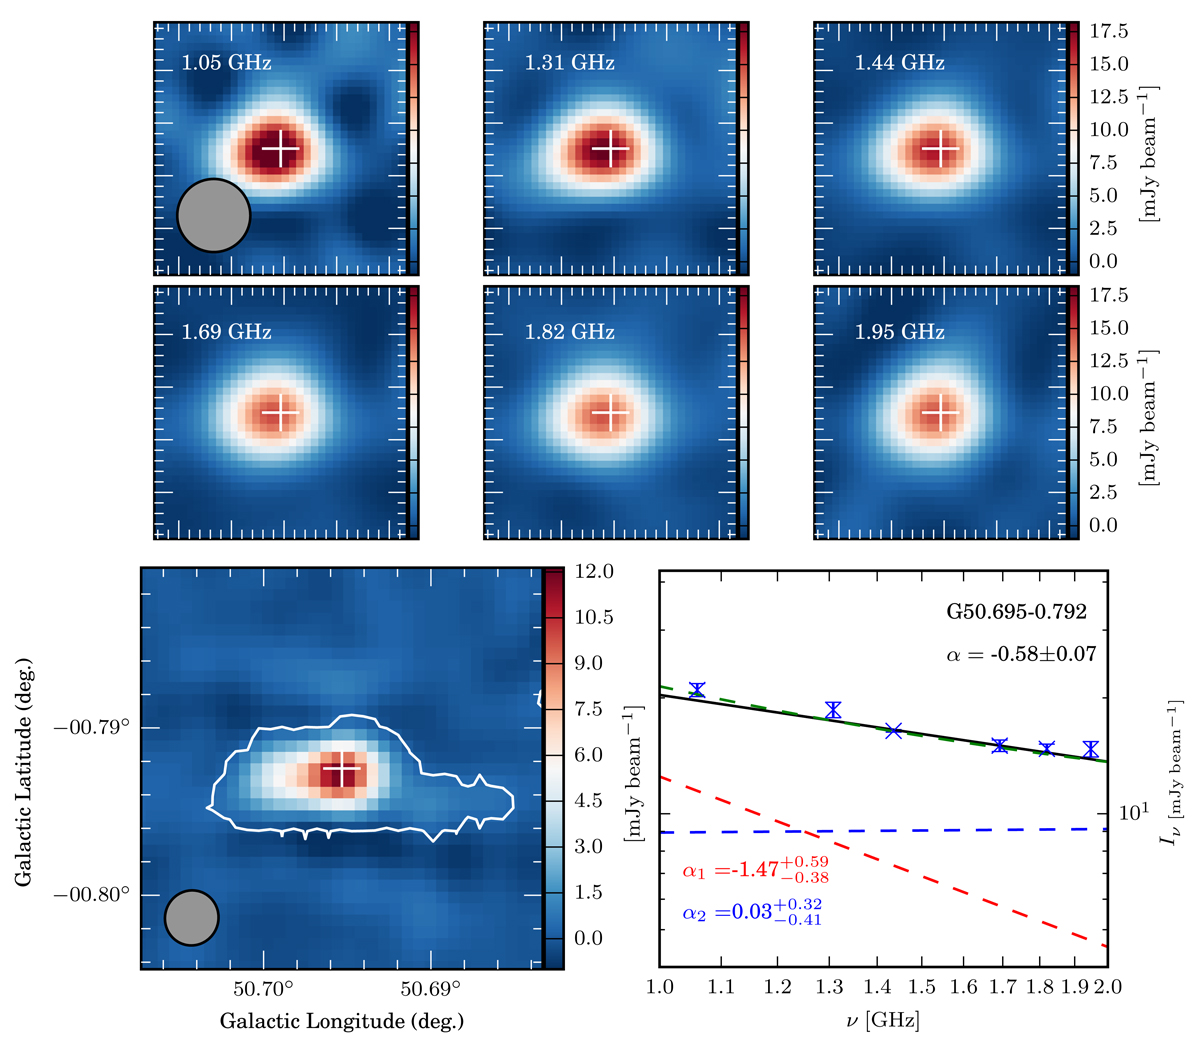
One example source G50.695−0.792 fitted with two indices. The top two panels show each SPW separately. The bottom left panel represents the averaged image of spw-1440 and spw-1820, which we used for the source extraction (see Sect. 3). The white contours show the extent of the source determined by the BLOBCAT algorithm. The cross in each panel marks the peak position, which we used to determine the spectral index. The bottom right panel presents the peak intensity for each SPW and corresponding one single spectral index fitting (black solid line) and two spectral indices fitting (green dashed lines) from two components (red and blue dashed lines).
Current usage metrics show cumulative count of Article Views (full-text article views including HTML views, PDF and ePub downloads, according to the available data) and Abstracts Views on Vision4Press platform.
Data correspond to usage on the plateform after 2015. The current usage metrics is available 48-96 hours after online publication and is updated daily on week days.
Initial download of the metrics may take a while.