Fig. 11.
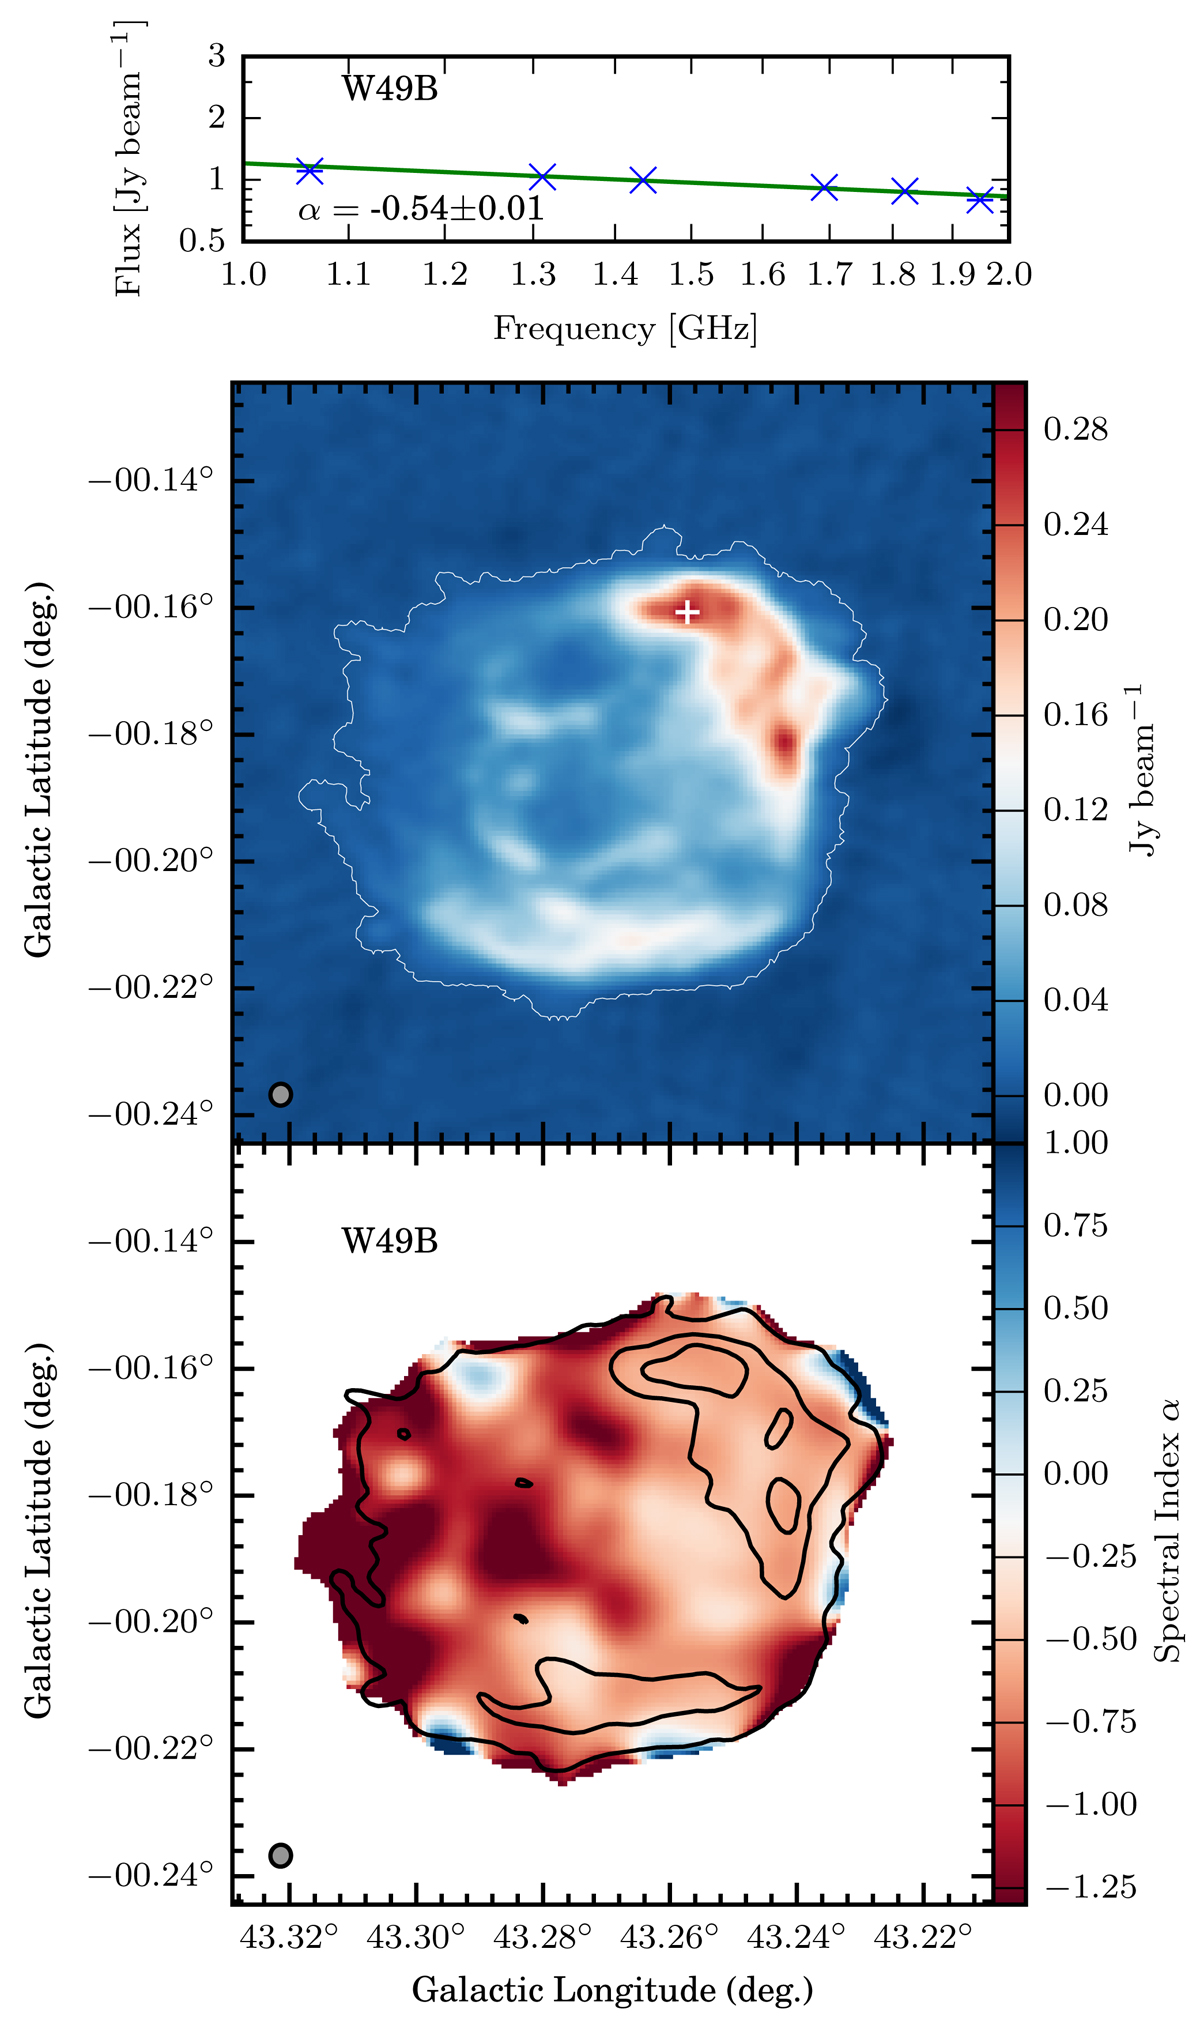
Spectral index map for SNR W49B. Top panel: spectral index fitting result of the peak of the continuum source G43.257−0.161. Middle panel: averaged image of spw-1440 and spw-1820, the white contours represent the area of the source extracted by BLOBCAT, and the cross denotes the peak of the source G43.257−0.161 in the catalog. Bottom panel: the spectral index map produced by fitting the flux of the 6 SPWs pixel by pixel. The synthesized beams of the averaged image and the spectral index map are shown in the bottom left corner of each panel.
Current usage metrics show cumulative count of Article Views (full-text article views including HTML views, PDF and ePub downloads, according to the available data) and Abstracts Views on Vision4Press platform.
Data correspond to usage on the plateform after 2015. The current usage metrics is available 48-96 hours after online publication and is updated daily on week days.
Initial download of the metrics may take a while.