Fig. 1.
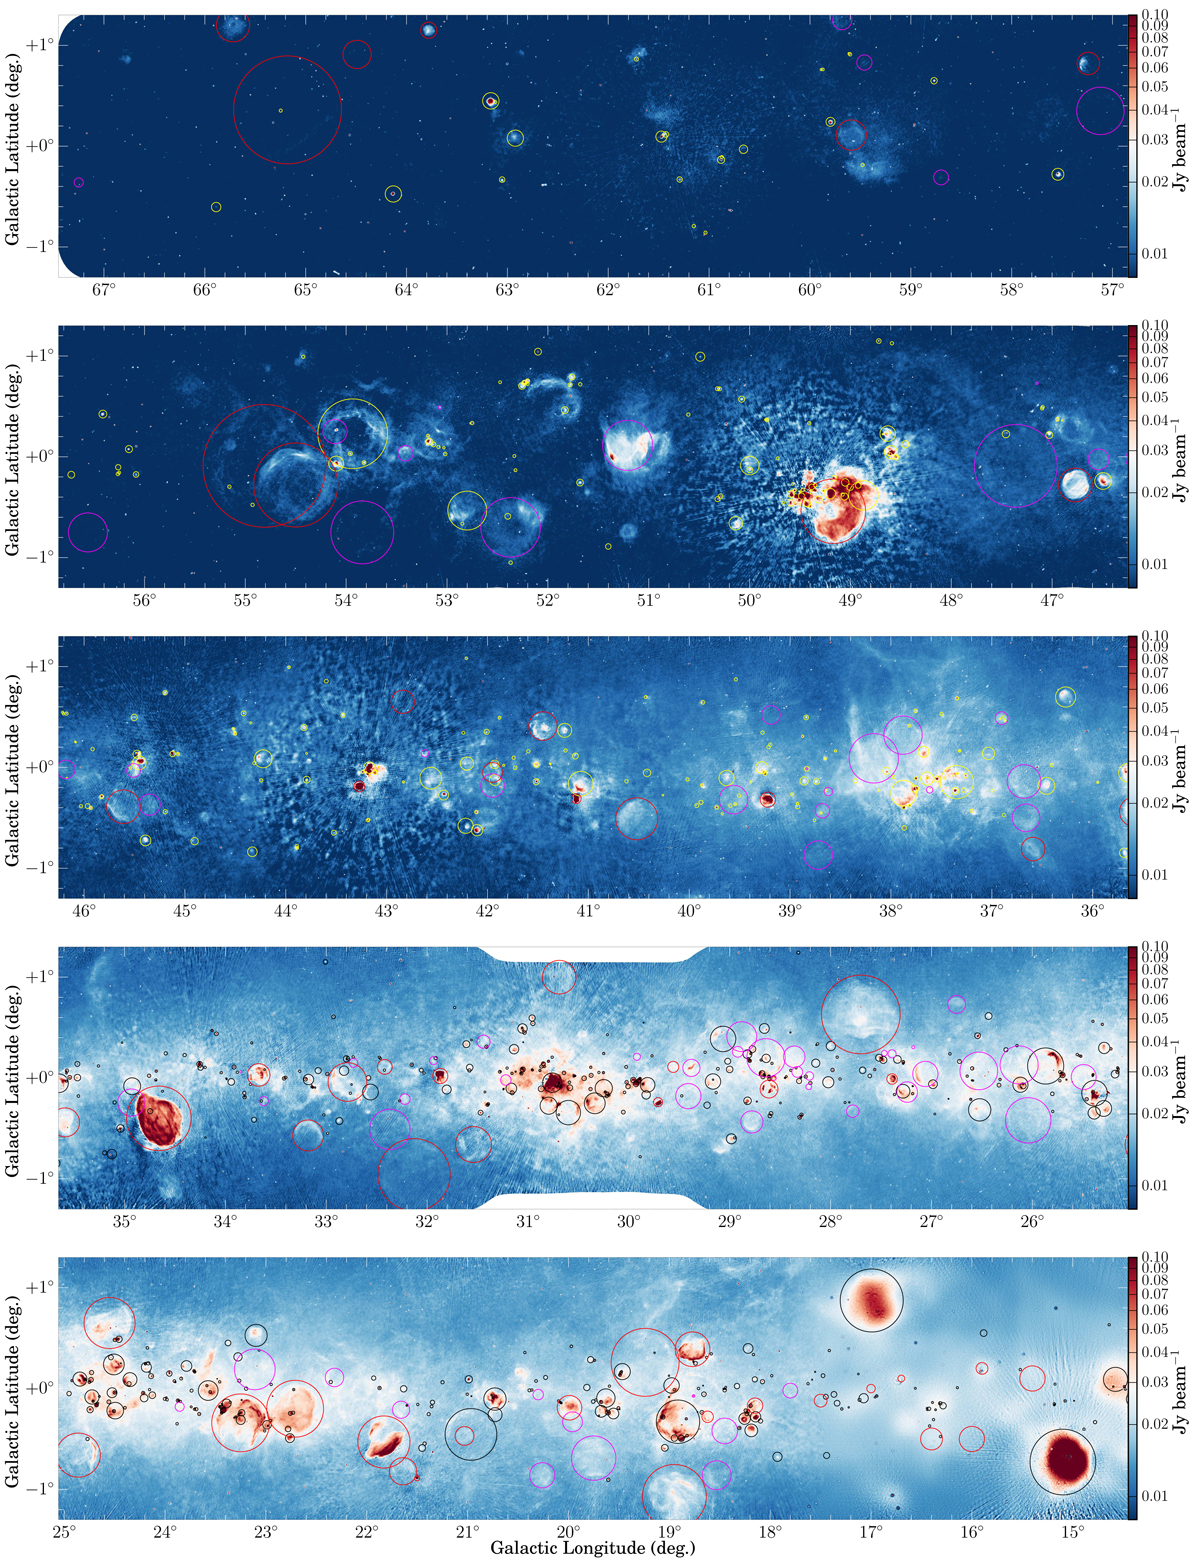
THOR+VGPS 1.4 GHz continuum map of the whole survey. The yellow and black circles denote the WISE H II regions (Anderson et al. 2017) matched with our continuum sources (see also Sect. 5.3). The red circles indicate the SNRs from Green (2014). The magenta circles indicate the new SNR candidates identified in this combined dataset (Anderson et al. 2017). The synthesized beam size is 25″. For regions l < 17.5°, complementary D-configuration data do not exist. Therefore, in these regions we have only combined the THOR data with the Effelsberg data.
Current usage metrics show cumulative count of Article Views (full-text article views including HTML views, PDF and ePub downloads, according to the available data) and Abstracts Views on Vision4Press platform.
Data correspond to usage on the plateform after 2015. The current usage metrics is available 48-96 hours after online publication and is updated daily on week days.
Initial download of the metrics may take a while.