Free Access
Fig. A.1.
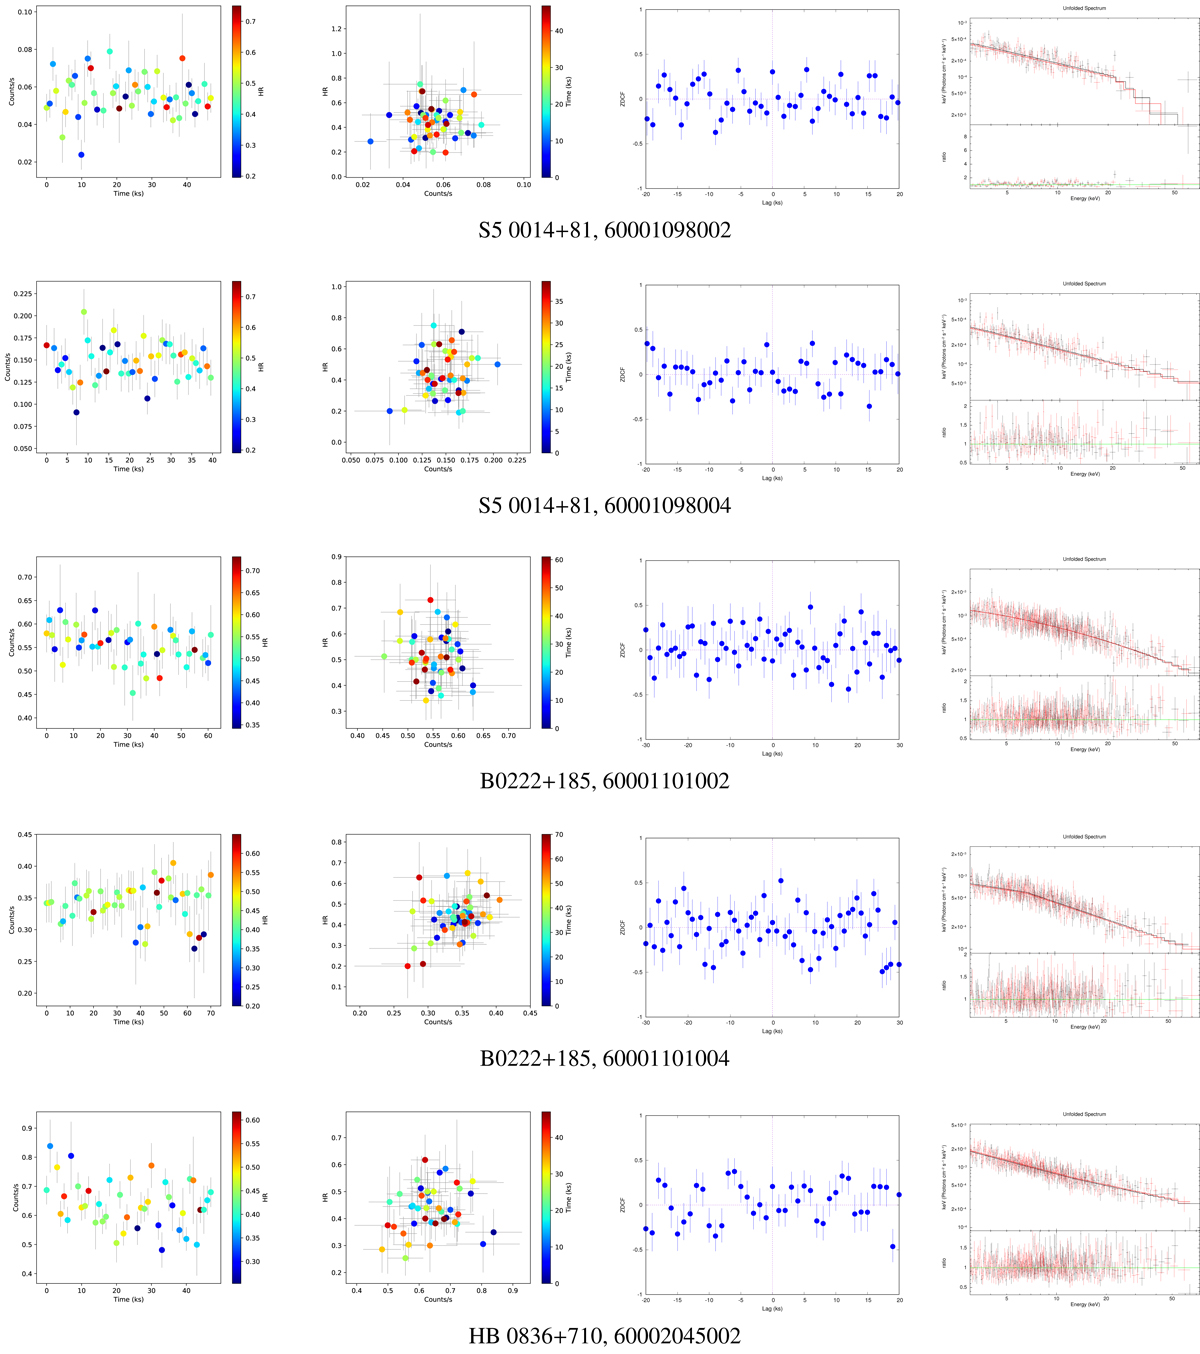
In each row: light curve, flux-HR relation, ZDCF, and spectral fit from left to right respectively, for the NuSTAR blazar observations listed in the Table 2. The color bars in the light curve and flux-HR plots represent the HR and time, respectively.
Current usage metrics show cumulative count of Article Views (full-text article views including HTML views, PDF and ePub downloads, according to the available data) and Abstracts Views on Vision4Press platform.
Data correspond to usage on the plateform after 2015. The current usage metrics is available 48-96 hours after online publication and is updated daily on week days.
Initial download of the metrics may take a while.