Fig. 1.
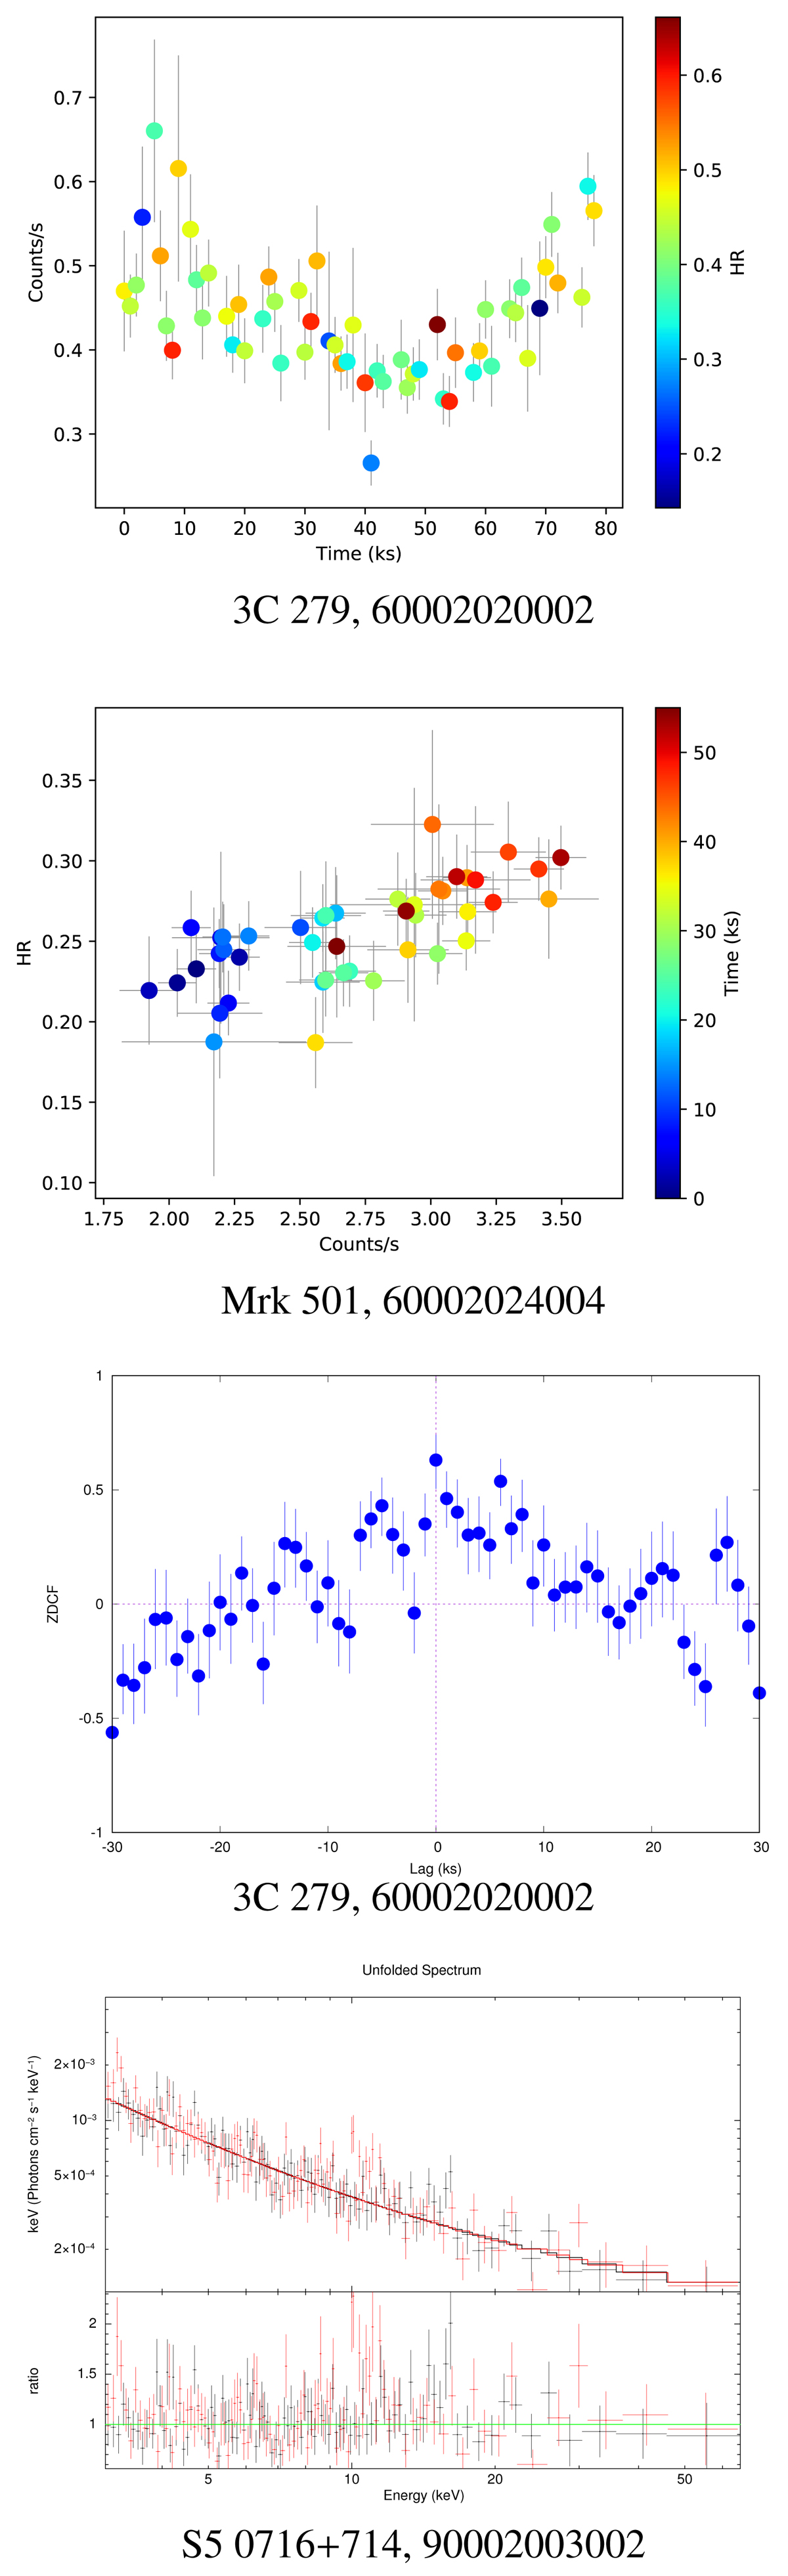
Hard X-ray NuSTAR observations of blazar sources showing light curve and flux-HR relation, ZDCF, and spectral fit from top to bottom for the sources 3C 279, Mrk 501, 3C 279, and S5 0716+714, respectively. The color bars in light curve and the flux-HR plots represent the HR and time, respectively. Similar plots for other sources are shown in Appendix A.
Current usage metrics show cumulative count of Article Views (full-text article views including HTML views, PDF and ePub downloads, according to the available data) and Abstracts Views on Vision4Press platform.
Data correspond to usage on the plateform after 2015. The current usage metrics is available 48-96 hours after online publication and is updated daily on week days.
Initial download of the metrics may take a while.