Free Access
Fig. 6.
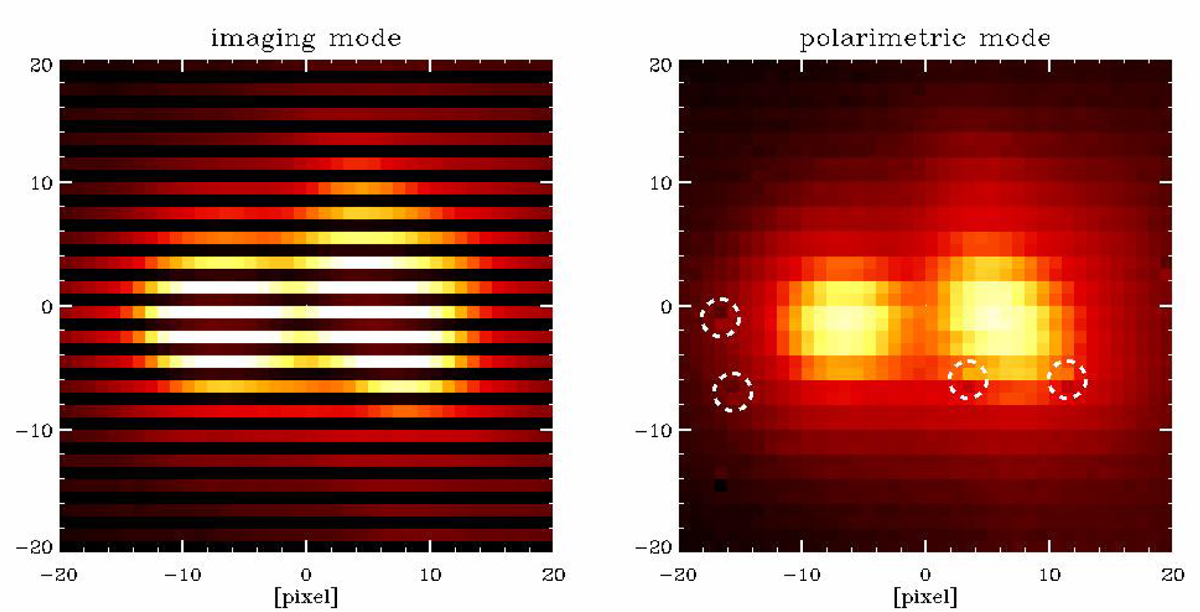
Raw counts for the central 40 × 40 pixel regions of the Hα images for the central R Aqr binary, separation 45 mas, taken in imaging mode (left) and in polarimetric mode (right). The dotted circles in the polarimetric data indicate spurious charge shifting effects.
Current usage metrics show cumulative count of Article Views (full-text article views including HTML views, PDF and ePub downloads, according to the available data) and Abstracts Views on Vision4Press platform.
Data correspond to usage on the plateform after 2015. The current usage metrics is available 48-96 hours after online publication and is updated daily on week days.
Initial download of the metrics may take a while.