Free Access
Fig. 5
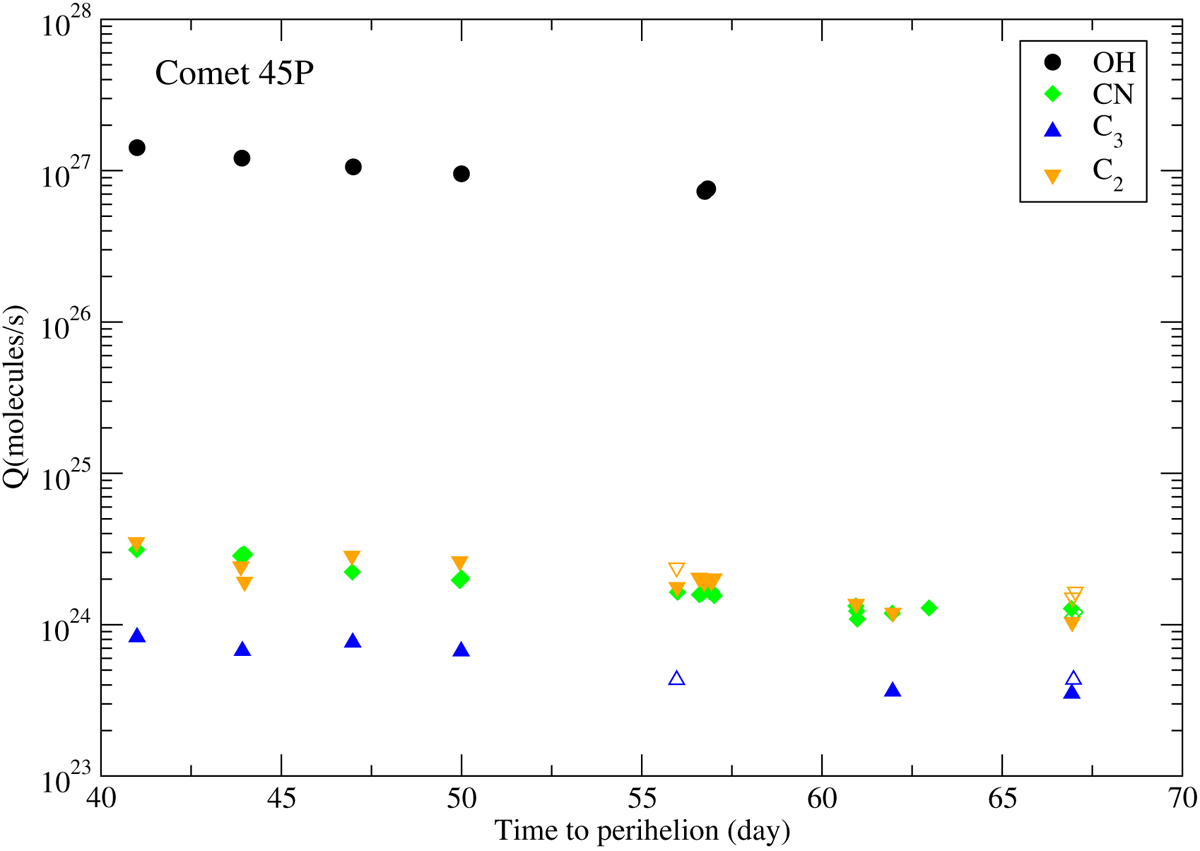
Logarithm of the production rates of 45P for each observed molecular species as a function of time to perihelion. The TN data are represented with filled symbols and TS data with open symbols. The values and their uncertainties are given in Table 3.
Current usage metrics show cumulative count of Article Views (full-text article views including HTML views, PDF and ePub downloads, according to the available data) and Abstracts Views on Vision4Press platform.
Data correspond to usage on the plateform after 2015. The current usage metrics is available 48-96 hours after online publication and is updated daily on week days.
Initial download of the metrics may take a while.