Fig. 4
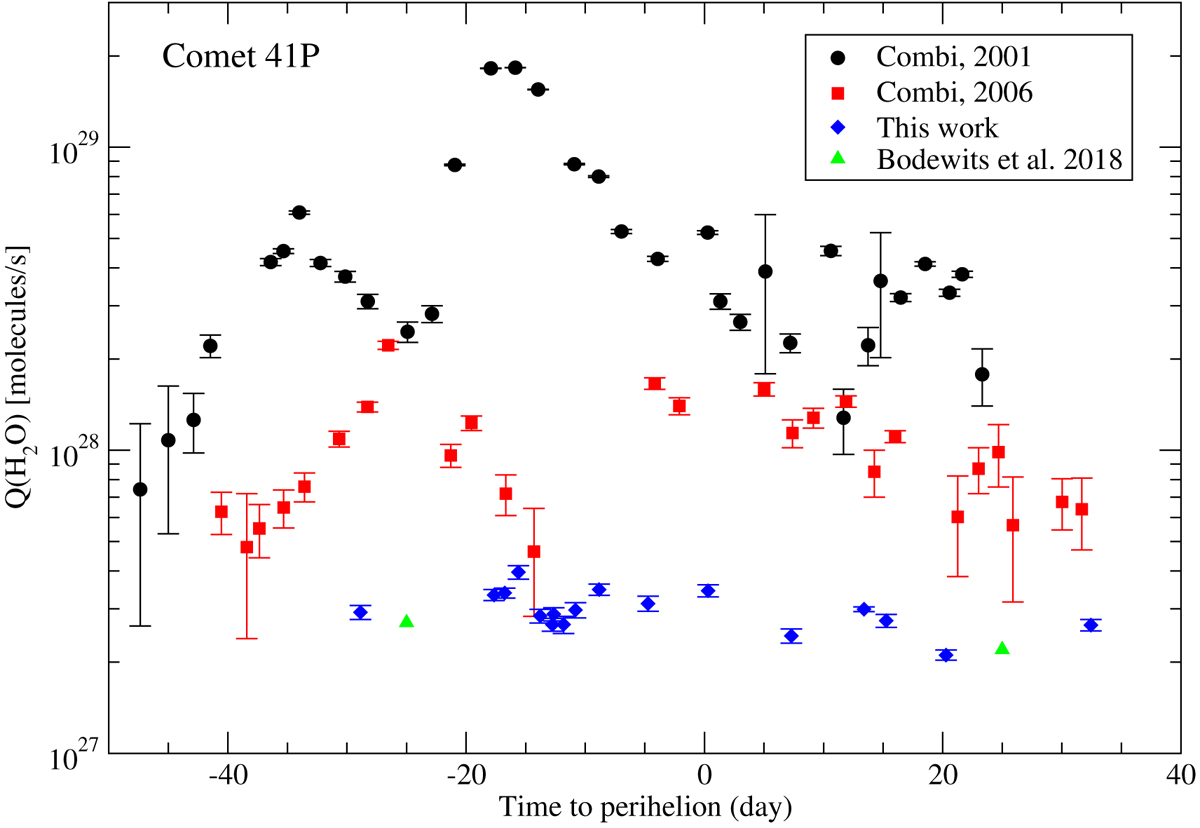
Logarithm of the water-production rate for different apparitions of comet 41P in 2001, 2006 and 2017 as a function of time to perihelion. Combi (2017) derived the production rates from hydrogen Lyman-α emission observed by the SWAN instrument onboard SOHO in 2001 (black circles) and 2006 (red squares). Our water-production rates (blue diamonds) were derived from the OH production rates using the relationship given in Cochran & Schleicher (1993). The water-production rates given in Bodewits et al. (2018) are derived from the Swift/UVOT observations of OH emissions (green triangles) and are in good agreement with the TRAPPIST ones.
Current usage metrics show cumulative count of Article Views (full-text article views including HTML views, PDF and ePub downloads, according to the available data) and Abstracts Views on Vision4Press platform.
Data correspond to usage on the plateform after 2015. The current usage metrics is available 48-96 hours after online publication and is updated daily on week days.
Initial download of the metrics may take a while.