Fig. 9.
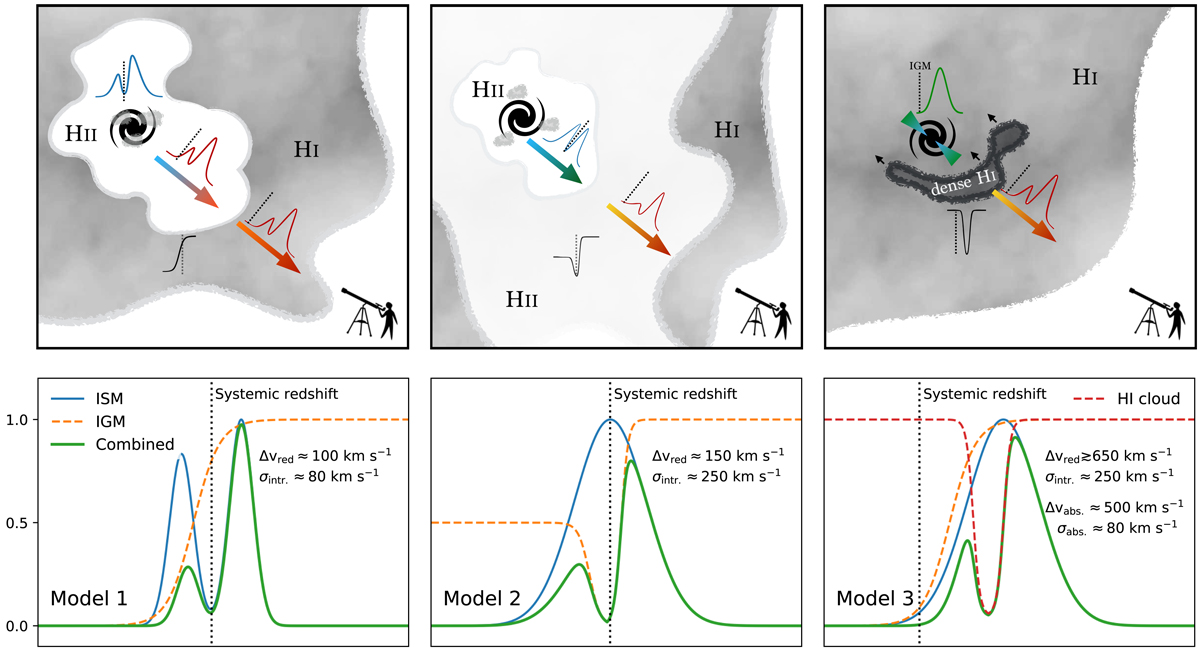
Sketches of different scenarios that may explain the observed Lyα line-profile of COLA1. Top row: sketches of the physical scenarios and bottom row: emerging Lyα spectrum. Left panel: Model 1 shows a double peaked emission line emerging from scattering in the ISM that is redshifted due to the expansion of the Universe before encountering the IGM, that preferentially attenuates the blue component. Middle panel: Model 2 shows that a double peak may originate due to a low transmission at line centre (due to neutral hydrogen in the CGM), while there is a relatively high transmission at further distances from the galaxy due to a large relatively ionised region (similar to the IGM transmission curve at z ≈ 4 in Laursen et al. 2011). Right panel: Model 3 shows that a double peaked profile can also arise without IGM attenuation in case there is an HI absorber slightly blue shifted with respect to the systemic Lyα velocity (which in this model is significantly redshifted with respect to the IGM).
Current usage metrics show cumulative count of Article Views (full-text article views including HTML views, PDF and ePub downloads, according to the available data) and Abstracts Views on Vision4Press platform.
Data correspond to usage on the plateform after 2015. The current usage metrics is available 48-96 hours after online publication and is updated daily on week days.
Initial download of the metrics may take a while.