Fig. 6.
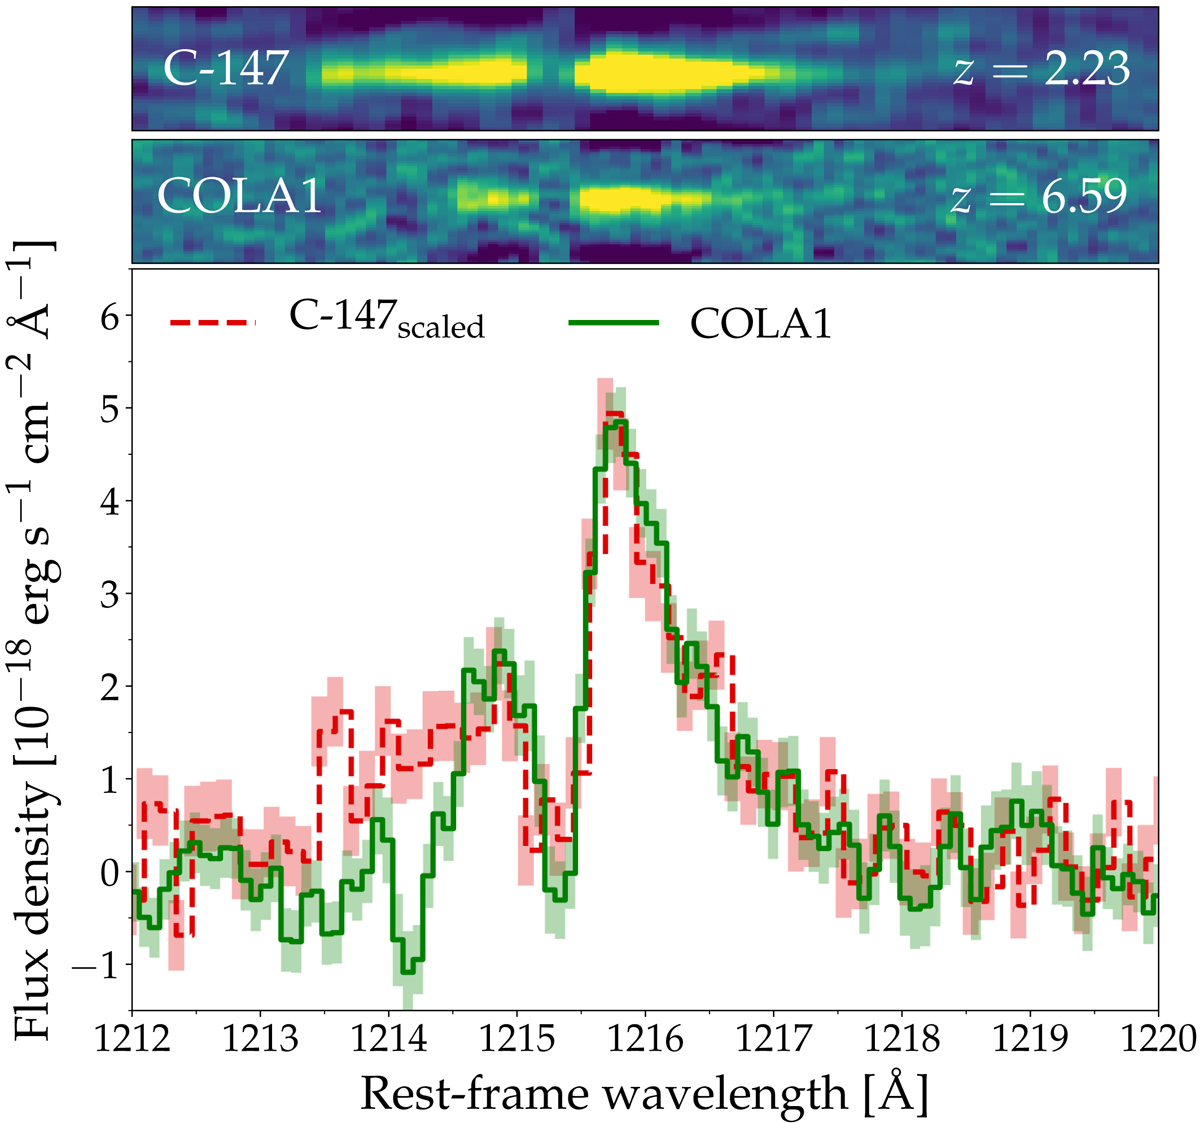
X-shooter spectrum of COLA1, shifted to rest-frame Lyα at z = 6.593 (green), compared to spectra of C-147 (red dashed line, a double peaked LAE at z = 2.23 confirmed through Hα emission, scaled to the peak flux in the red line; Sobral et al. 2018b). The profile of the red line in COLA1 resembles the Lyα profile of C-147 remarkably well. The blue component of COLA1 is cut at Δυ ≈ −250 km s−1, and thus narrower than C-147, potentially due to a higher optical depth at large distance from COLA1.
Current usage metrics show cumulative count of Article Views (full-text article views including HTML views, PDF and ePub downloads, according to the available data) and Abstracts Views on Vision4Press platform.
Data correspond to usage on the plateform after 2015. The current usage metrics is available 48-96 hours after online publication and is updated daily on week days.
Initial download of the metrics may take a while.