Fig. 3.
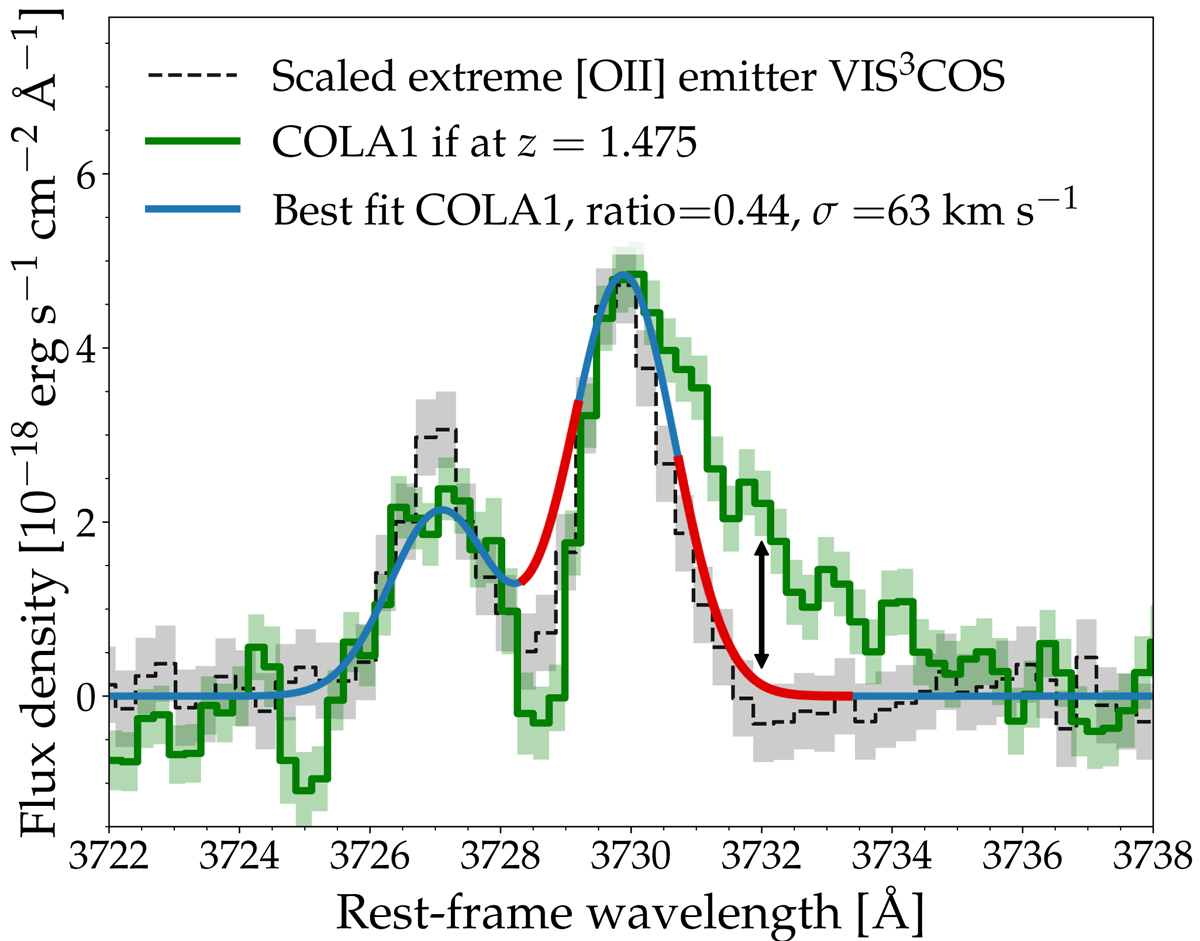
X-shooter spectrum of COLA1, shifted to rest-frame wavelengths assuming it is an [OII] emitter at z = 1.475 (green). Dashed black lines show the median [OII] profile of the [OII] emitters in the VIS3COS survey (Paulino-Afonso et al. 2018a) that are selected on having extreme blue/red ratios and asymmetric red lines. The blue line shows our fitted [OII] doublet to the spectrum of COLA1, and the red line indicates where the fit is > 3σ away from the data. The asymmetry in the red line (not present in the blue line) and the absence of flux in between the lines are at odds with COLA1 being an [OII] emitter.
Current usage metrics show cumulative count of Article Views (full-text article views including HTML views, PDF and ePub downloads, according to the available data) and Abstracts Views on Vision4Press platform.
Data correspond to usage on the plateform after 2015. The current usage metrics is available 48-96 hours after online publication and is updated daily on week days.
Initial download of the metrics may take a while.