Fig. 2.
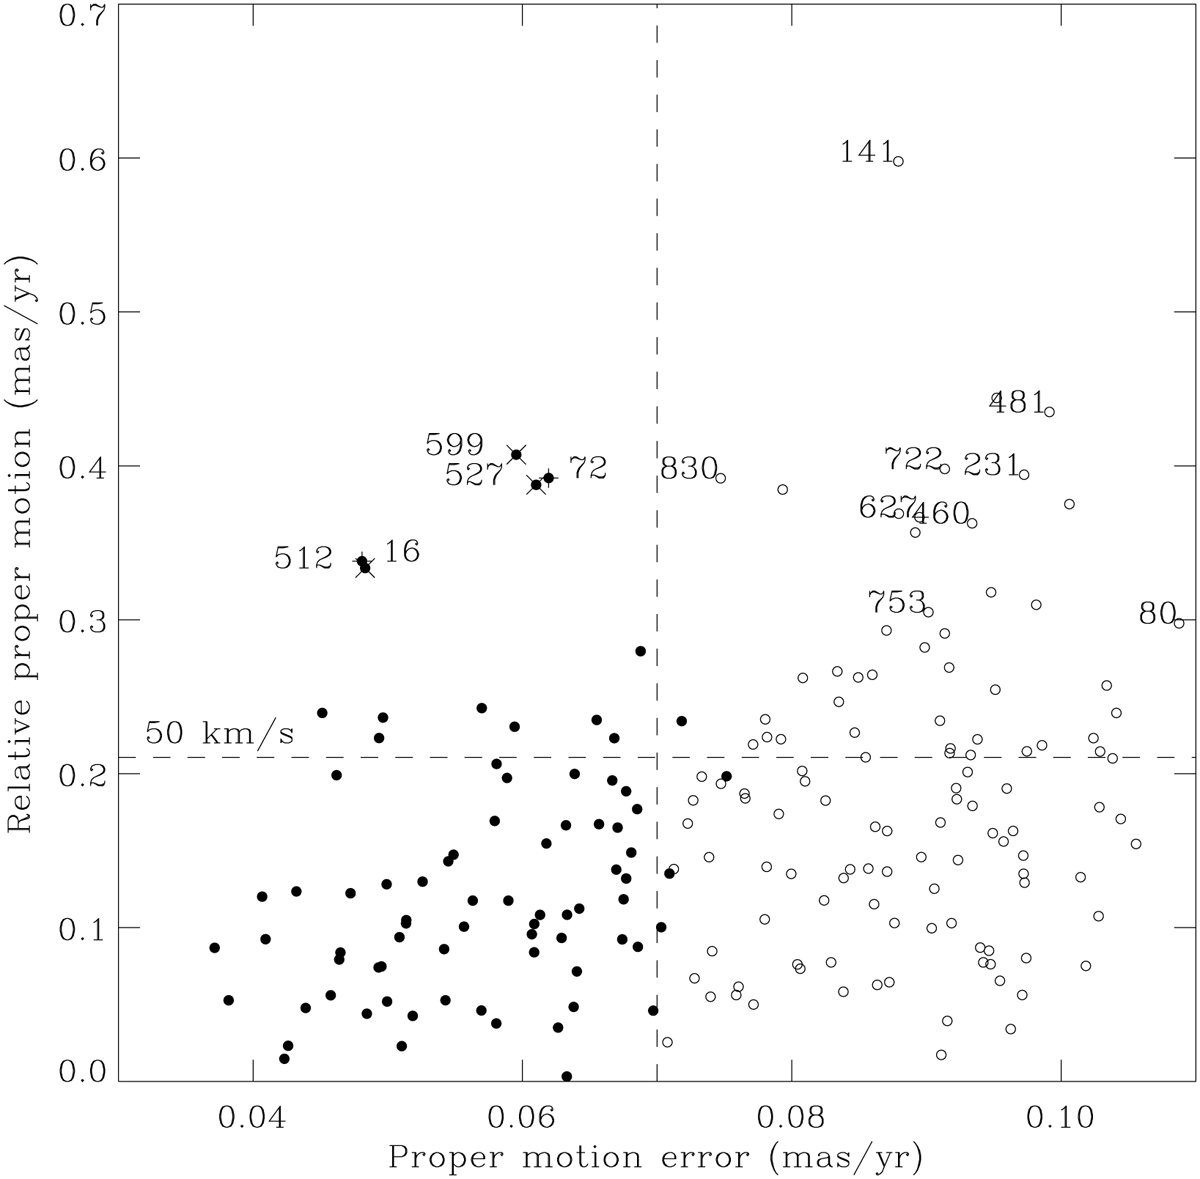
Comparison of relative proper motion versus the magnitude of the semi-major axis of the error ellipse of the proper motion for all 193 O-stars in our core sample, with the filled symbols representing those stars with errors less than 0.07 mas yr−1 in both proper motion ordinates. Ignoring outliers, it is apparent that the dispersion of proper motions begins to increase significantly above 0.07 mas yr−1 (vertical dashed line). For illustration the horizontal dashed line represents a velocity of 50 km s−1 at the distance of the LMC. Labels are the VFTS identification numbers for those stars discussed in the text.
Current usage metrics show cumulative count of Article Views (full-text article views including HTML views, PDF and ePub downloads, according to the available data) and Abstracts Views on Vision4Press platform.
Data correspond to usage on the plateform after 2015. The current usage metrics is available 48-96 hours after online publication and is updated daily on week days.
Initial download of the metrics may take a while.