Fig. 5.
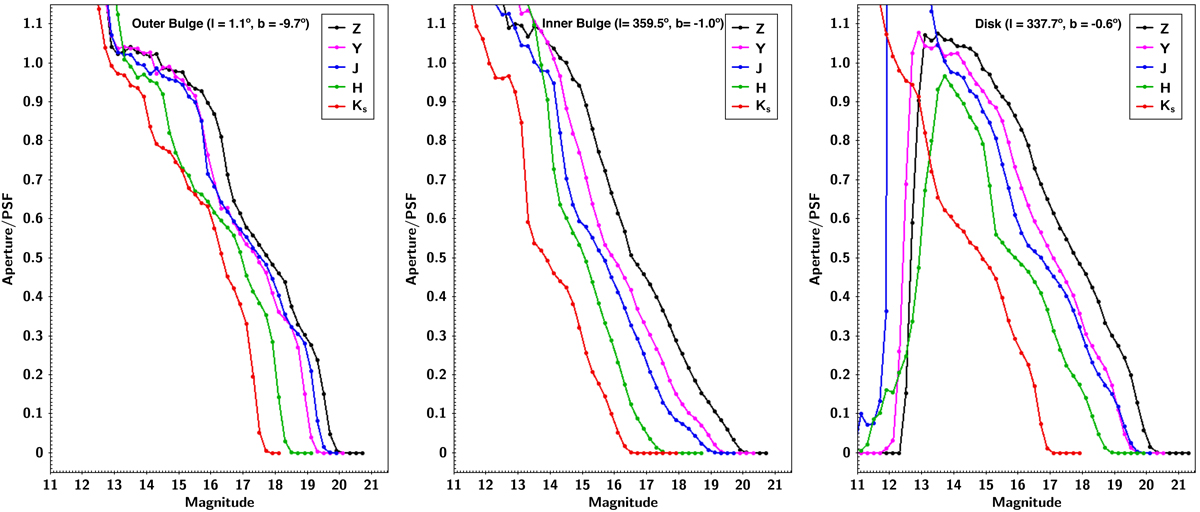
Ratios of the number of detected sources as a function of magnitude between our PSF photometry and CASU aperture photometry catalogs for representative fields in the VVV outermost bulge (left panel), VVV innermost bulge (middle panel) and VVV disk (right panel). The analyzed VVV fields are the same as in Fig. 3. Our PSF photometry reaches dimmer detection limits, by as much as ∼1−1.5 for the most crowded region in the inner bulge. The completeness is also higher over most of the magnitude range for all the different filters, and in all the different regions surveyed, while maintaining small photometric errors (see Fig. 3). The higher detection ratios with aperture photometry at the bright end are due to the use of a more conservative saturation limit with the PSF photometry.
Current usage metrics show cumulative count of Article Views (full-text article views including HTML views, PDF and ePub downloads, according to the available data) and Abstracts Views on Vision4Press platform.
Data correspond to usage on the plateform after 2015. The current usage metrics is available 48-96 hours after online publication and is updated daily on week days.
Initial download of the metrics may take a while.