Free Access
Fig. 8.
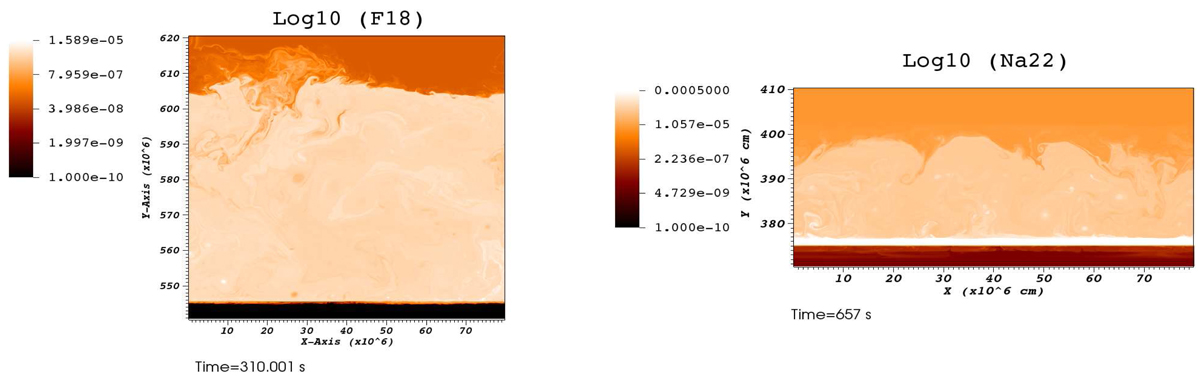
Development of the initial fluid instabilities at the CEI at t = 310s, in terms of 18F mass fraction and in logarithmic scale, for model 1.0 M⊙ CO (panel a), and at t = 657s, in terms of 22Na mass fraction and in logarithmic scale, for model 1.25 M⊙ ONe (panel b). Identical plots are obtained for the other chemical species.
Current usage metrics show cumulative count of Article Views (full-text article views including HTML views, PDF and ePub downloads, according to the available data) and Abstracts Views on Vision4Press platform.
Data correspond to usage on the plateform after 2015. The current usage metrics is available 48-96 hours after online publication and is updated daily on week days.
Initial download of the metrics may take a while.