Free Access
Fig. 3.
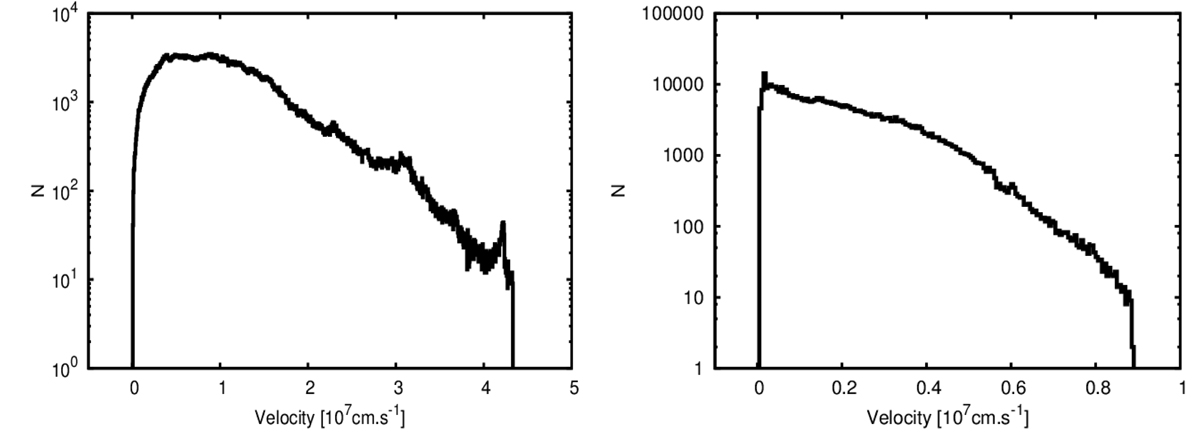
Velocity histograms for models 1.0 M⊙ CO at t = 310s (panel a) and 1.25 M⊙ ONe at t = 657s (panel b). The discontinuities in the velocity are due to different stages of the turbulent mixing during the burning advance.
Current usage metrics show cumulative count of Article Views (full-text article views including HTML views, PDF and ePub downloads, according to the available data) and Abstracts Views on Vision4Press platform.
Data correspond to usage on the plateform after 2015. The current usage metrics is available 48-96 hours after online publication and is updated daily on week days.
Initial download of the metrics may take a while.