Fig. 7.
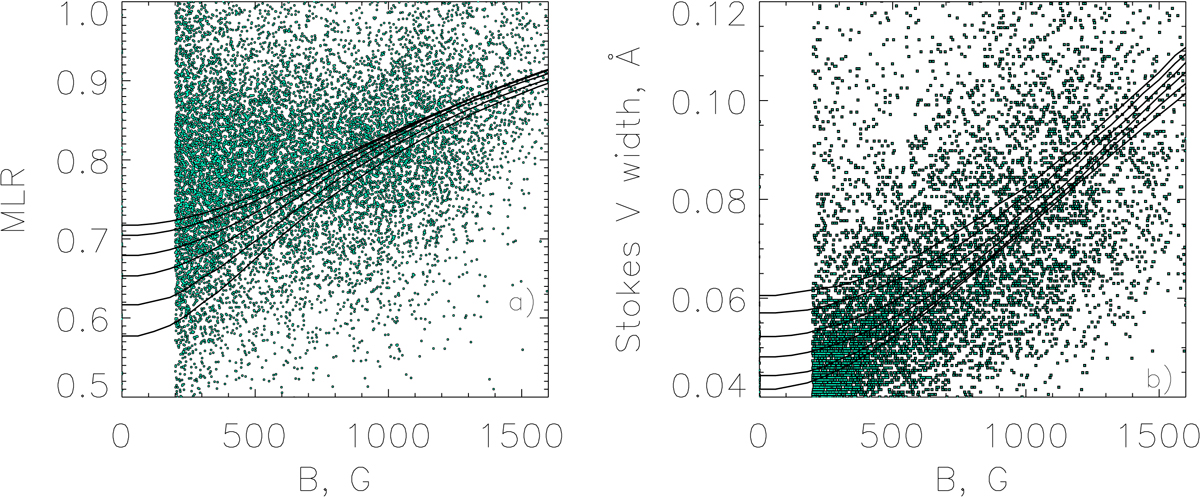
Panel a: calibration curves for MLR. Panel b: calibration curves for Stokes V widths of the 6301.5 Å line. In both panels different lines correspond to different widths of the I ± V profile of the 6301.5 Å line: the lowest line corresponds to 0.12 Å and the highest line corresponds to 0.23 Å. Green dots show MLR values (left panel) and Stokes V widths (right panel) taken from the MURAM-NICOLE simulations. Values below 100 G are ignored.
Current usage metrics show cumulative count of Article Views (full-text article views including HTML views, PDF and ePub downloads, according to the available data) and Abstracts Views on Vision4Press platform.
Data correspond to usage on the plateform after 2015. The current usage metrics is available 48-96 hours after online publication and is updated daily on week days.
Initial download of the metrics may take a while.