Fig. 6.
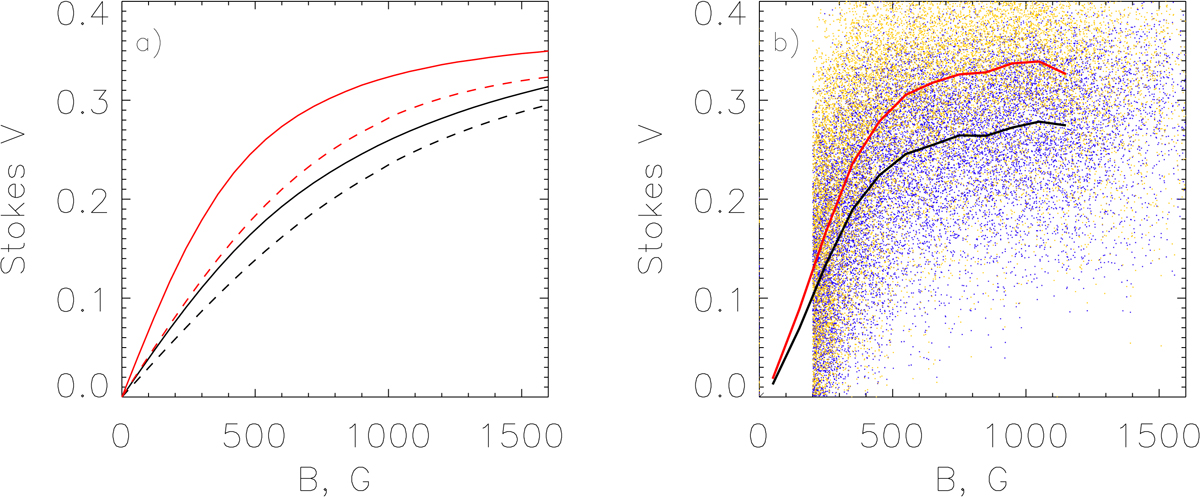
Panel a: calibration curves for the considered Fe I lines. Black and red lines are for the 6301.5 and 6302.5 Å lines, respectively. Solid and dashed lines are for line widths of 0.12 and 0.23, respectively. Panel b: Stokes V amplitudes taken from the MURAM-NICOLE simulations. Blue and orange dots are for the 6301.5 and 6302.5 Å lines, respectively. Black and red lines show sliding averages for the 6301.5 and 6302.5 Å lines, respectively.
Current usage metrics show cumulative count of Article Views (full-text article views including HTML views, PDF and ePub downloads, according to the available data) and Abstracts Views on Vision4Press platform.
Data correspond to usage on the plateform after 2015. The current usage metrics is available 48-96 hours after online publication and is updated daily on week days.
Initial download of the metrics may take a while.