Fig. 6
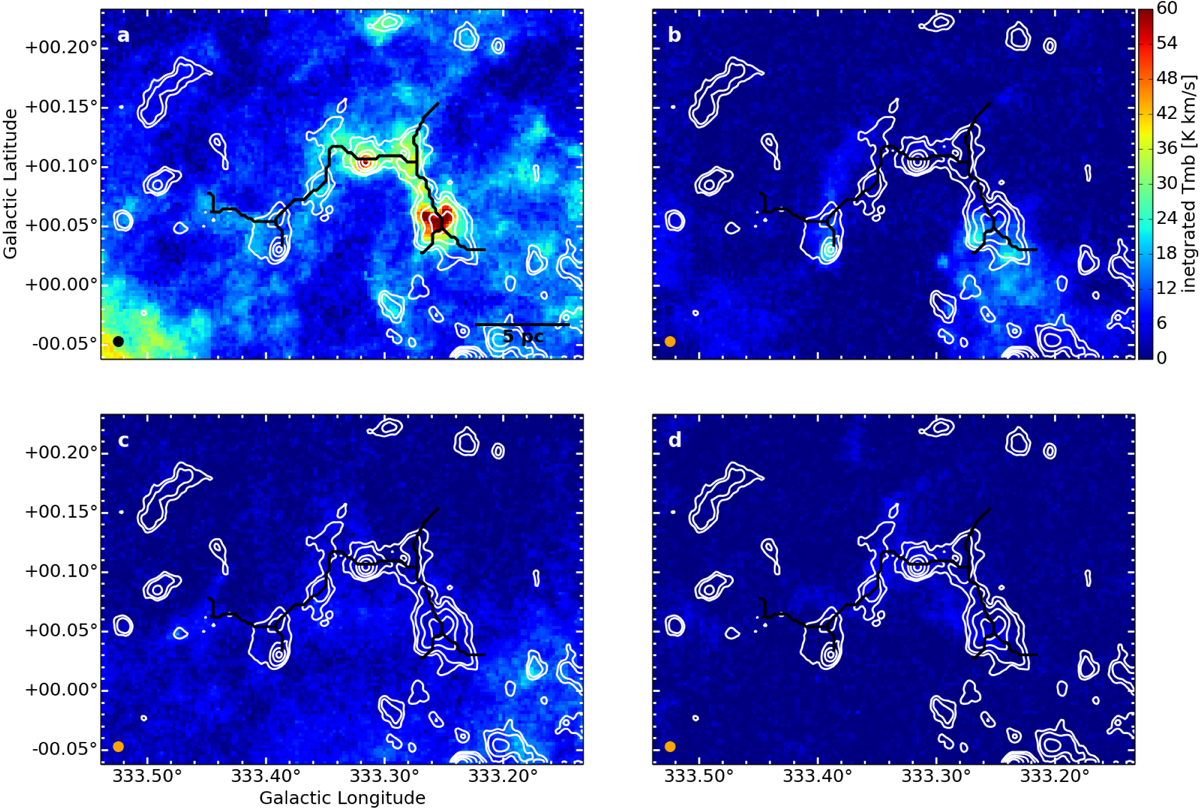
Integrated 13CO(2 – 1) emission of the four velocity components of the filament candidate G333.297+00.073. The intensity was integrated over the velocity ranges − 55.0 to − 40.5 km s−1 (top left panel), − 74.0 to − 66.0 km s−1 (top right panel), − 96.0 to − 86.0 km s−1 (bottom left panel) and − 82.5 to − 76 km s−1 (bottom right panel). The beamsize is indicated by the circle in the lower left and the contours show the ATLASGAL [0.1, 0.2, 0.5, 1.0, 2.0] Jy beam−1 levels. The letters in the upper right refer to the marked intervals in Fig. 3.
Current usage metrics show cumulative count of Article Views (full-text article views including HTML views, PDF and ePub downloads, according to the available data) and Abstracts Views on Vision4Press platform.
Data correspond to usage on the plateform after 2015. The current usage metrics is available 48-96 hours after online publication and is updated daily on week days.
Initial download of the metrics may take a while.