Fig. B.1
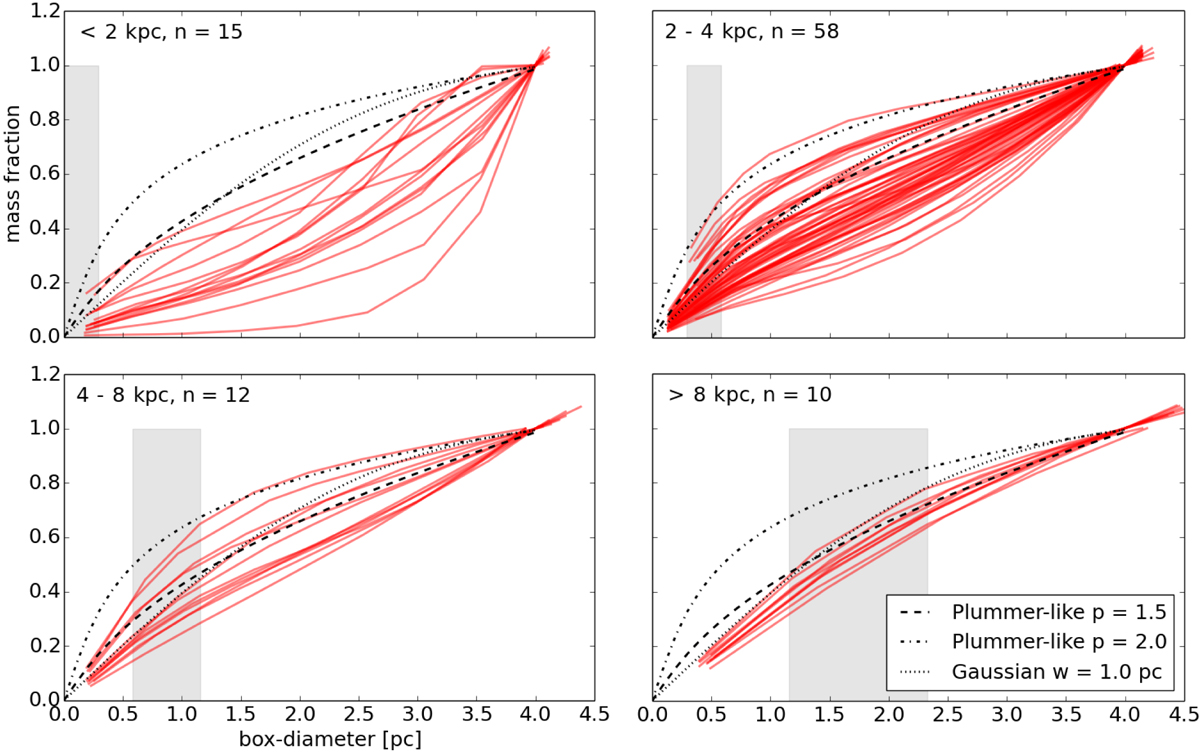
Fraction of the filament mass derived from corrected ATLASGAL+Planck dust continuum emission dependent on the box-diameter of the mask separated with distances. Top left panel: d < 2 kpc, top right panel: 2 kpc < d < 4 kpc, bottom left: 4 kpc < d < 8 kpc, bottom right panel: d > 8 kpc. The gray lines indicate the physical beam size at these distances. The black lines show the theoretical profiles, which describe a Plummer-like p = 1.5 (dashed) or p = 2.0 (dash-dotted), and a Gaussian with w = 1.0 (dotted).
Current usage metrics show cumulative count of Article Views (full-text article views including HTML views, PDF and ePub downloads, according to the available data) and Abstracts Views on Vision4Press platform.
Data correspond to usage on the plateform after 2015. The current usage metrics is available 48-96 hours after online publication and is updated daily on week days.
Initial download of the metrics may take a while.