Fig. A.2
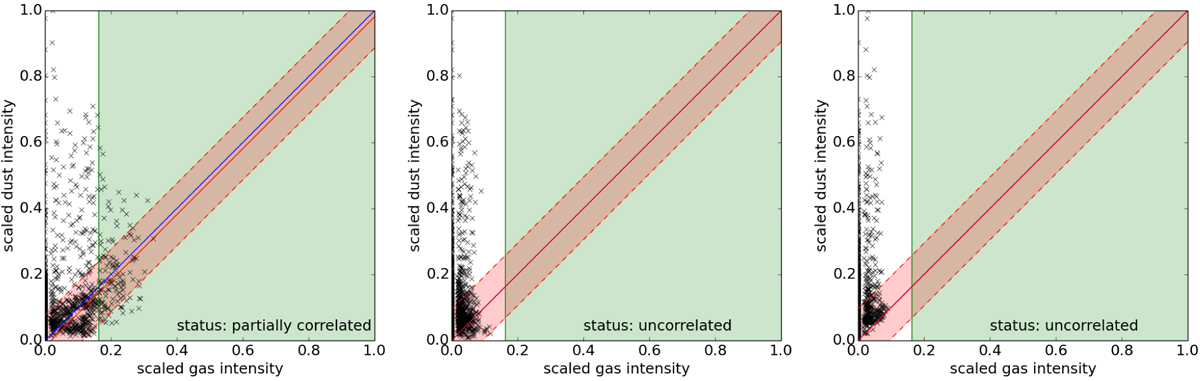
Gas-dust correlation plots of the velocity components “b”,“c”, and “d” of the filament candidate G333.297+00.073 (see Figs. 3, 5, and 6). The blue line gives the one-to-one correlation. The green area indicates values above the σgas limit. The red line shows the fitting result, and the area within the dashed red lines marks the ± σcor surrounding. pcor,gas is estimated from the overlap of these areas.
Current usage metrics show cumulative count of Article Views (full-text article views including HTML views, PDF and ePub downloads, according to the available data) and Abstracts Views on Vision4Press platform.
Data correspond to usage on the plateform after 2015. The current usage metrics is available 48-96 hours after online publication and is updated daily on week days.
Initial download of the metrics may take a while.