Fig. 26
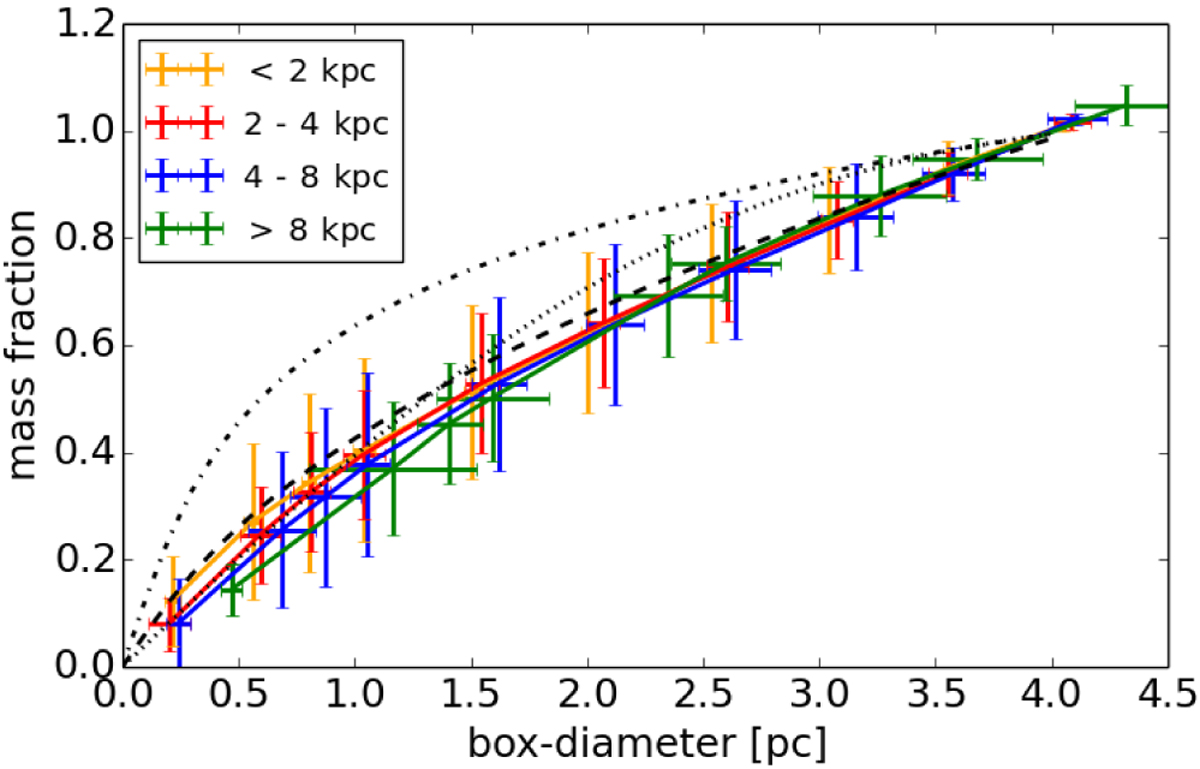
Average fraction of the filament mass derived from 13CO emission dependent on the box-diameter of the mask. The color indicates the distance of the filament with d1 orange, d2 red, d3 blue, and d4 green. The errorbars indicate the dispersion of the measured mass fraction and box-diameter. The black lines are same as Fig. 24.
Current usage metrics show cumulative count of Article Views (full-text article views including HTML views, PDF and ePub downloads, according to the available data) and Abstracts Views on Vision4Press platform.
Data correspond to usage on the plateform after 2015. The current usage metrics is available 48-96 hours after online publication and is updated daily on week days.
Initial download of the metrics may take a while.