Fig. 24
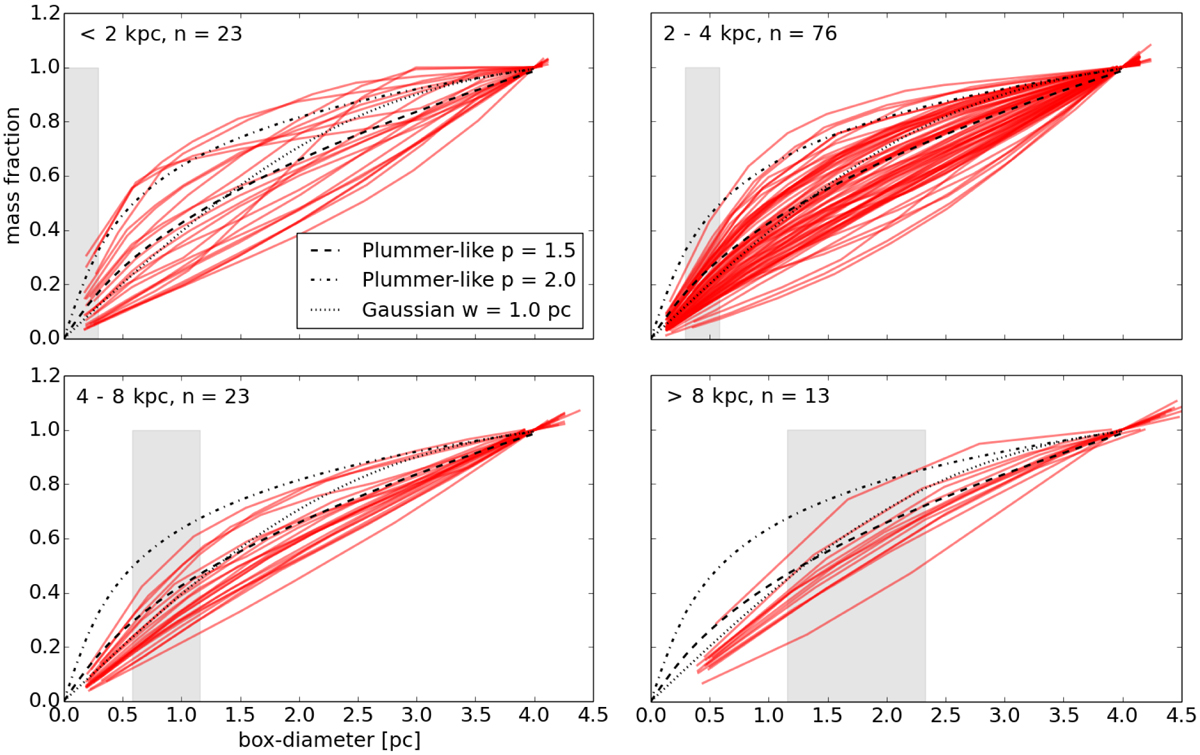
Fraction of the filament mass derived from 13CO emission dependent on the box-diameter of the mask separated by distances. Top left panel: d < 2 kpc, top right panel: 2 kpc < d < 4 kpc, bottom left panel: 4 kpc < d < 8 kpc, bottom right panel: d > 8 kpc. One curve describes one fully correlated filament at its distance estimate. The gray lines indicate the physical beamsize at distances of 2, 3, 6, and 8 kpc. The black lines show the integrated theoretical radial profiles, which describe a Plummer-like distribution p = 1.5 (dashed) or p = 2.0 (dash-dotted), and a Gaussian distribution with a dispersion of w = 1.0 (dotted).
Current usage metrics show cumulative count of Article Views (full-text article views including HTML views, PDF and ePub downloads, according to the available data) and Abstracts Views on Vision4Press platform.
Data correspond to usage on the plateform after 2015. The current usage metrics is available 48-96 hours after online publication and is updated daily on week days.
Initial download of the metrics may take a while.