Fig. 14
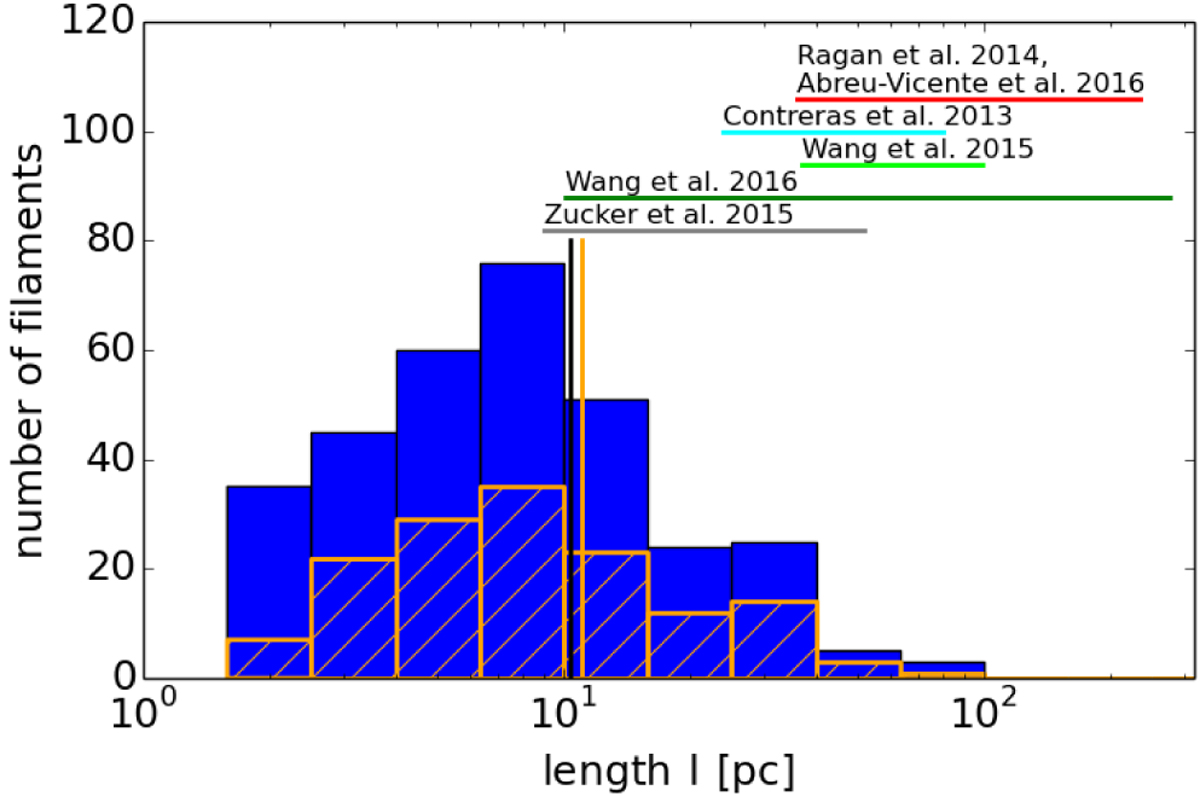
Distribution of the measured length over the detected skeleton of all filaments (blue). The fully correlated filaments are marked by the orange hatch. The vertical lines indicate the mean value for the complete (black) and the sub-sample (orange). The horizontal lines mark the length ranges measured by the studies mentioned above the lines.
Current usage metrics show cumulative count of Article Views (full-text article views including HTML views, PDF and ePub downloads, according to the available data) and Abstracts Views on Vision4Press platform.
Data correspond to usage on the plateform after 2015. The current usage metrics is available 48-96 hours after online publication and is updated daily on week days.
Initial download of the metrics may take a while.