Fig. 7.
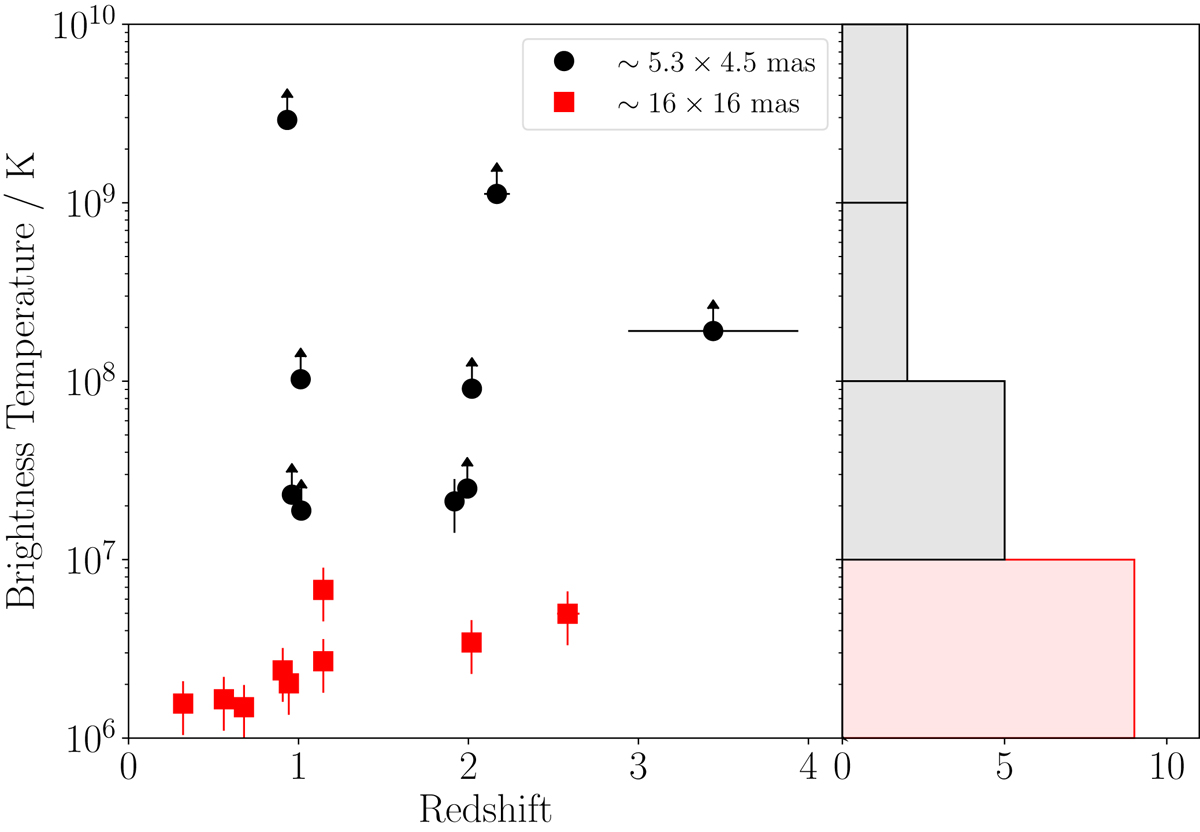
Brightness temperature distribution with respect to redshift. The black circles and red squares correspond to those sources detected with a ∼5.3 × 4.5 mas restoring beam and those detected with a ∼16 × 16 mas beam respectively. Arrows correspond to the lower limits for sources classified as unresolved (that is either θmaj or θmin is less than the minimum resolvable size). The histogram shows the distribution of brightness temperatures which is colour coded with the markers. The majority of brightness temperatures are between 106 and 108 K.
Current usage metrics show cumulative count of Article Views (full-text article views including HTML views, PDF and ePub downloads, according to the available data) and Abstracts Views on Vision4Press platform.
Data correspond to usage on the plateform after 2015. The current usage metrics is available 48-96 hours after online publication and is updated daily on week days.
Initial download of the metrics may take a while.