| Issue |
A&A
Volume 625, May 2019
|
|
|---|---|---|
| Article Number | C1 | |
| Number of page(s) | 2 | |
| Section | Catalogs and data | |
| DOI | https://doi.org/10.1051/0004-6361/201833399e | |
| Published online | 07 May 2019 | |
Nowhere to Hide: Radio-faint AGN in GOODS-N field
I. Initial catalogue and radio properties (Corrigendum)
1
Kapteyn Astronomical Institute, University of Groningen, 9747 AD Groningen, The Netherlands
e-mail: This email address is being protected from spambots. You need JavaScript enabled to view it.
2
Jodrell Bank Centre for Astrophysics/e-MERLIN, The University of Manchester, M13 9PL, UK
3
ASTRON, the Netherlands Institute for Radio Astronomy, Postbus 2, 7990 AA Dwingeloo, The Netherlands
4
Centre for Astrophysics and Supercomputing, Swinburne University of Technology, PO Box 218 Hawthorn, VIC 3122, Australia
5
Joint Institute for VLBI ERIC, Postbus 2, 7990 AA Dwingeloo, The Netherlands
Received:
11
March
2019
Accepted:
11
March
2019
Key words: catalogs / radio continuum: galaxies / galaxies: active / galaxies: nuclei / techniques: high angular resolution / errata, addenda
We discovered an error in the coding for the expression calculating the radio power, L1.5 GHz. In the original manuscript, the radio power was calculated using the VLA radio peak brightnesses whereas it should be calculated using the integrated flux densities. Whilst this makes little difference to compact sources, extended objects (e.g. J123656+615659, J123644+621133 and J123726+621129) had radio powers underestimated by up to an order of magnitude. This error has no significant effect upon the conclusions of the original manuscript. We outline where this error affects the original manuscript in the following couple of paragraphs.
Figure 6 and Table 3 are affected in the original manuscript and are corrected in this erratum. The online table at CDS has also been corrected.
On page 11, last sentence of the first paragraph should be: “As Fig. 6 shows, we sample a large range of radio powers from ∼1022 − 1026 W Hz−1 which have a median luminosity of 3.5 × 1024 W Hz−1”.
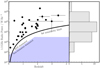 |
Fig. 6. Radio power vs. redshift for our VLBI sources. 1σ uncertainties on radio power and redshifts are plotted. The bold black curve represents the theoretical radio power that these VLBI observations are sensitive to (assuming all the VLA flux is contained in a milliarcsecond core) corresponding to 54 μJy beam−1 or 6× VLBI central rms The region above the blue shaded area represents the AGN dominated regime defined using the selection criteria of Magliocchetti et al. (2018). The histogram shows the distribution of the radio powers of which peak between 1024 and 1025 W Hz−1. |
Derived VLA and VLBI radio properties of the 31 GOODS-N AGN.
References
- Magliocchetti, M., Popesso, P., Brusa, M., & Salvato, M. 2018, MNRAS, 473, 2493 [NASA ADS] [CrossRef] [Google Scholar]
© ESO 2019
All Tables
All Figures
|
Fig. 6. Radio power vs. redshift for our VLBI sources. 1σ uncertainties on radio power and redshifts are plotted. The bold black curve represents the theoretical radio power that these VLBI observations are sensitive to (assuming all the VLA flux is contained in a milliarcsecond core) corresponding to 54 μJy beam−1 or 6× VLBI central rms The region above the blue shaded area represents the AGN dominated regime defined using the selection criteria of Magliocchetti et al. (2018). The histogram shows the distribution of the radio powers of which peak between 1024 and 1025 W Hz−1. |
| In the text | |
Current usage metrics show cumulative count of Article Views (full-text article views including HTML views, PDF and ePub downloads, according to the available data) and Abstracts Views on Vision4Press platform.
Data correspond to usage on the plateform after 2015. The current usage metrics is available 48-96 hours after online publication and is updated daily on week days.
Initial download of the metrics may take a while.