Fig. 6.
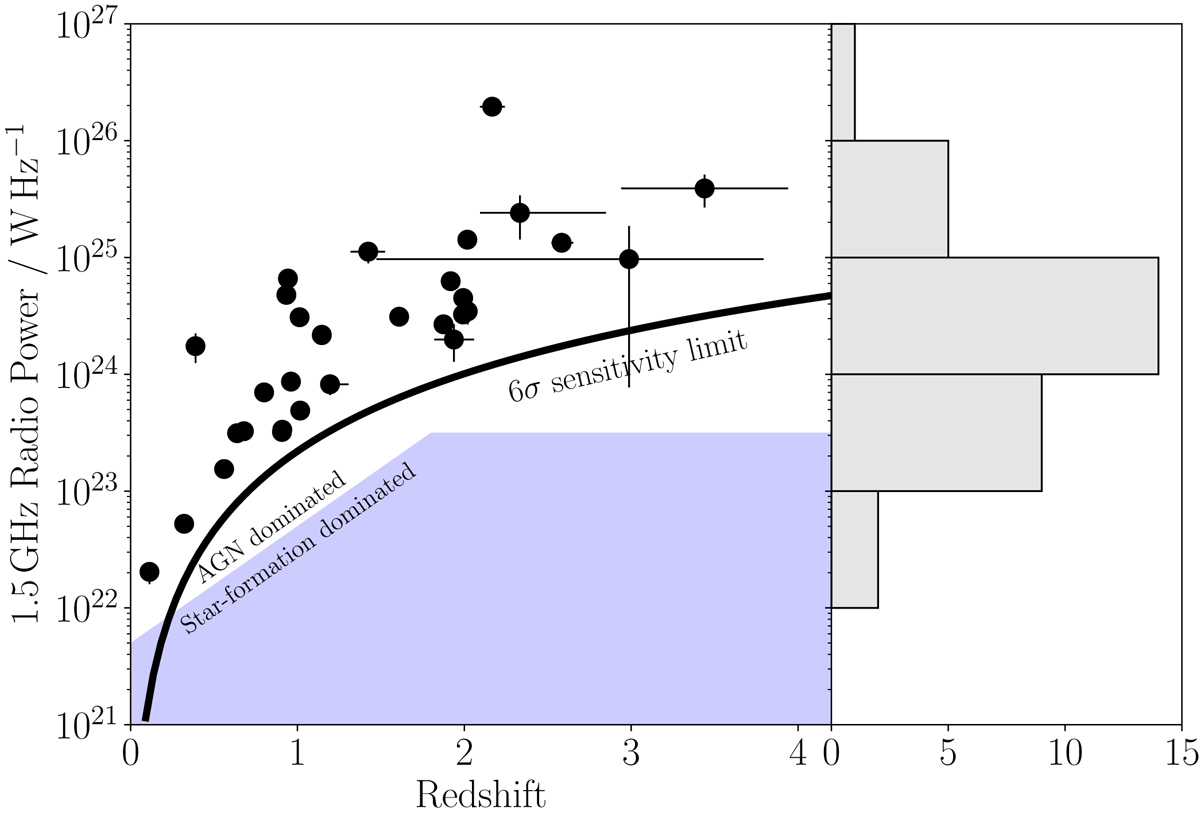
Radio power vs. redshift for our VLBI sources. 1σ uncertainties on radio power and redshifts are plotted. The bold black curve represents the theoretical radio power that these VLBI observations are sensitive to (assuming all the VLA flux is contained in a milliarcsecond core) corresponding to 54 μJy beam−1 or 6 × VLBI central rms The region above the blue shaded area represents the AGN dominated regime defined using the selection criteria of Magliocchetti et al. (2018). The histogram shows the distribution of the radio powers of which peak between 1024 and 1025 WHz−1.
Current usage metrics show cumulative count of Article Views (full-text article views including HTML views, PDF and ePub downloads, according to the available data) and Abstracts Views on Vision4Press platform.
Data correspond to usage on the plateform after 2015. The current usage metrics is available 48-96 hours after online publication and is updated daily on week days.
Initial download of the metrics may take a while.