Fig. 5.
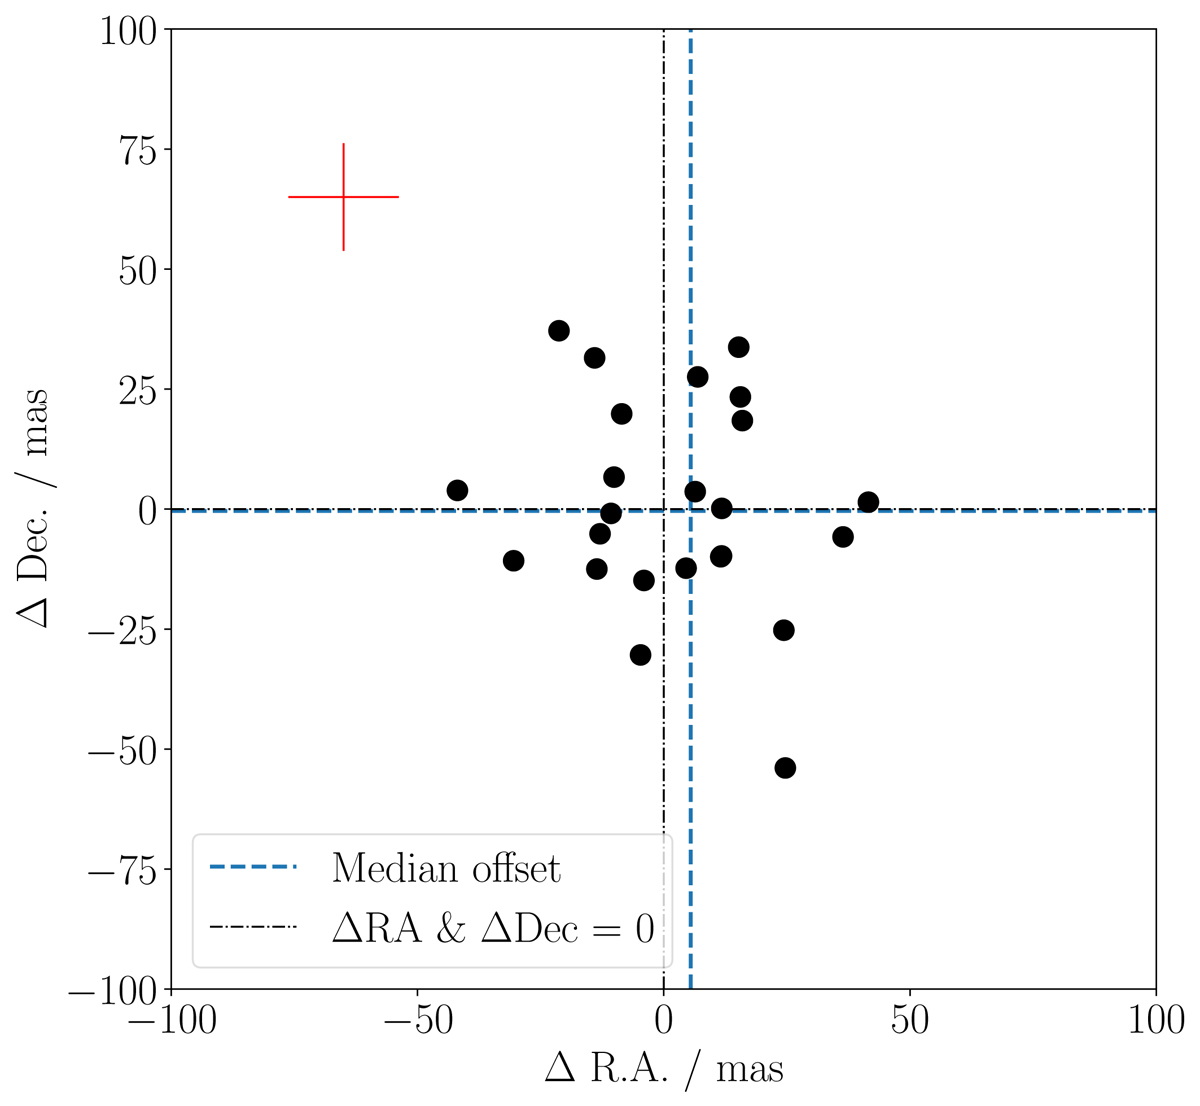
Relative astrometric precision between Muxlow et al. (2005) and these observations. The blue dashed line is the mean RA and Dec shifts corresponding to 5.5 and −0.4 milliarcseconds respectively. The black dot-dashed line corresponds to ΔRA = 0 and ΔDec = 0. The red cross indicates the typical error per data point (which does not include corejet blending uncertainties).
Current usage metrics show cumulative count of Article Views (full-text article views including HTML views, PDF and ePub downloads, according to the available data) and Abstracts Views on Vision4Press platform.
Data correspond to usage on the plateform after 2015. The current usage metrics is available 48-96 hours after online publication and is updated daily on week days.
Initial download of the metrics may take a while.