Fig. 9.
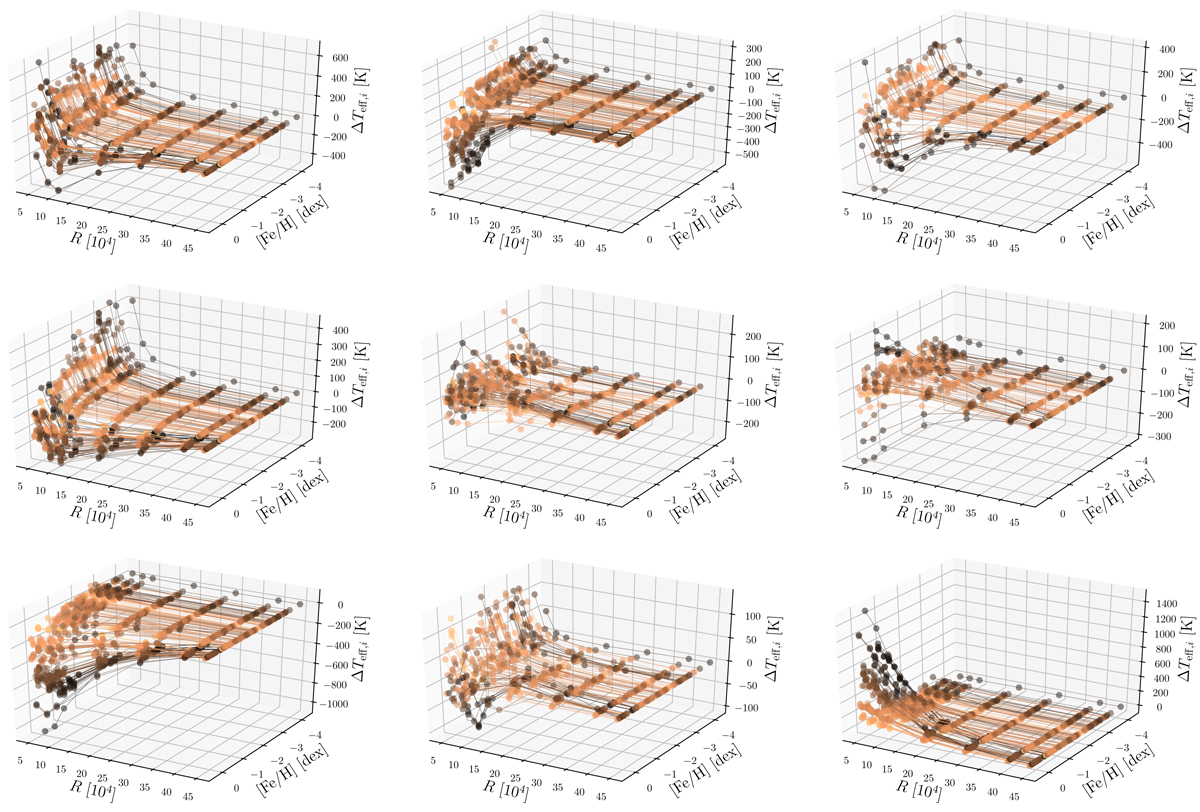
T eff deviations with respect to resolution and [Fe/H] ordered from the strongest to the weakest relation (see Table A.1 and Fig. 5) from top left to bottom right. The deviations were computed by scaling ΔFR with the slope of the respective relation. Points measured for the same star but at different Rs are connected by solid lines. The color coding is the same T eff scale as in Fig. 7.
Current usage metrics show cumulative count of Article Views (full-text article views including HTML views, PDF and ePub downloads, according to the available data) and Abstracts Views on Vision4Press platform.
Data correspond to usage on the plateform after 2015. The current usage metrics is available 48-96 hours after online publication and is updated daily on week days.
Initial download of the metrics may take a while.