Fig. 7.
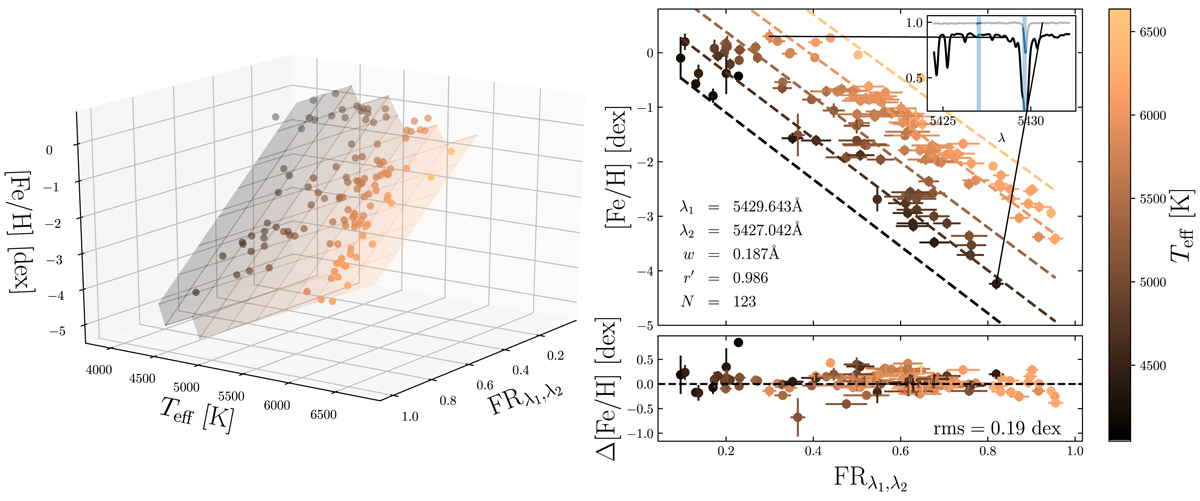
[Fe/H] dependency on FR and T eff. The left panel illustrates the distribution of points of the tightest relation in FR-T eff-[Fe/H] space and the surface they span therein. To guide the eye, the best-fit surface according to Eq. (10) is overlaid as a light-colored, distorted grid, where the grid lines indicate the isothermal and iso-FR lines. The same distribution of points is shown in the top right panel but in a coordinate frame that is rotated such that it is aligned with the FR and [Fe/H] axes. Dashed lines indicate the track of the isothermal lines on the surface. In analogy to Fig. 4, the inlay shows the most extreme spectra in terms of metallicity, as well as the two wavelength regions the FR was computed from (blue). The fit residuals with respect to FR are presented in the lower right frame. All three scatter-plots follow the same T eff color coding as indicated by the bar on the right.
Current usage metrics show cumulative count of Article Views (full-text article views including HTML views, PDF and ePub downloads, according to the available data) and Abstracts Views on Vision4Press platform.
Data correspond to usage on the plateform after 2015. The current usage metrics is available 48-96 hours after online publication and is updated daily on week days.
Initial download of the metrics may take a while.