Fig. 20.
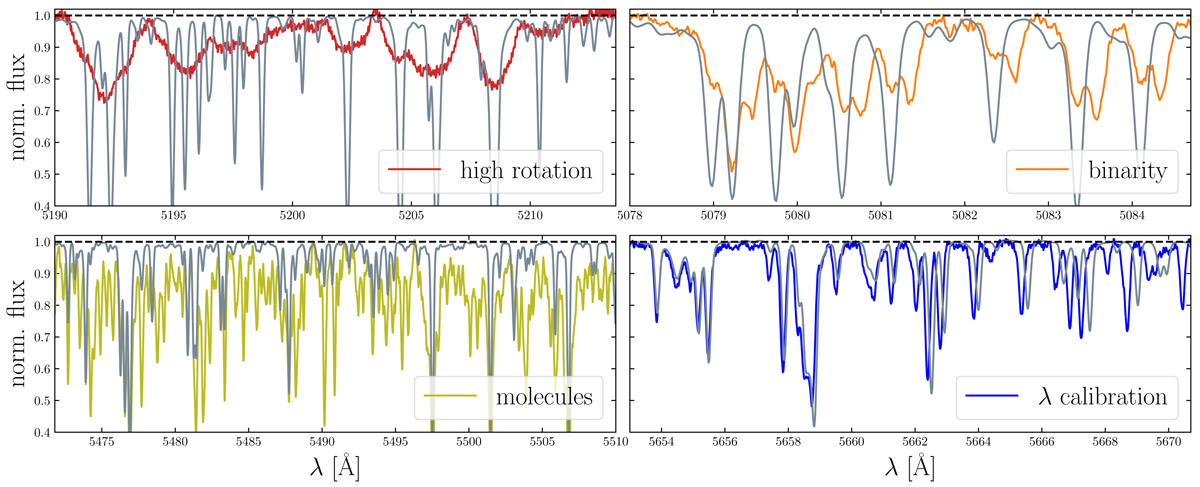
Comparison of representative peculiar spectra (colored in the same way as in Fig. 19) to the solar spectrum (gray). An approximate normalization was performed by manually setting the continuum. The wavelength ranges were chosen such that the respective reason for peculiarity is illustrated best. The GES identifiers of the stars are (from upper left to lower right) 08100380-4901071, 18184436-4500066, 23001517-2231268, and 08090542-4740261.
Current usage metrics show cumulative count of Article Views (full-text article views including HTML views, PDF and ePub downloads, according to the available data) and Abstracts Views on Vision4Press platform.
Data correspond to usage on the plateform after 2015. The current usage metrics is available 48-96 hours after online publication and is updated daily on week days.
Initial download of the metrics may take a while.