Fig. 15.
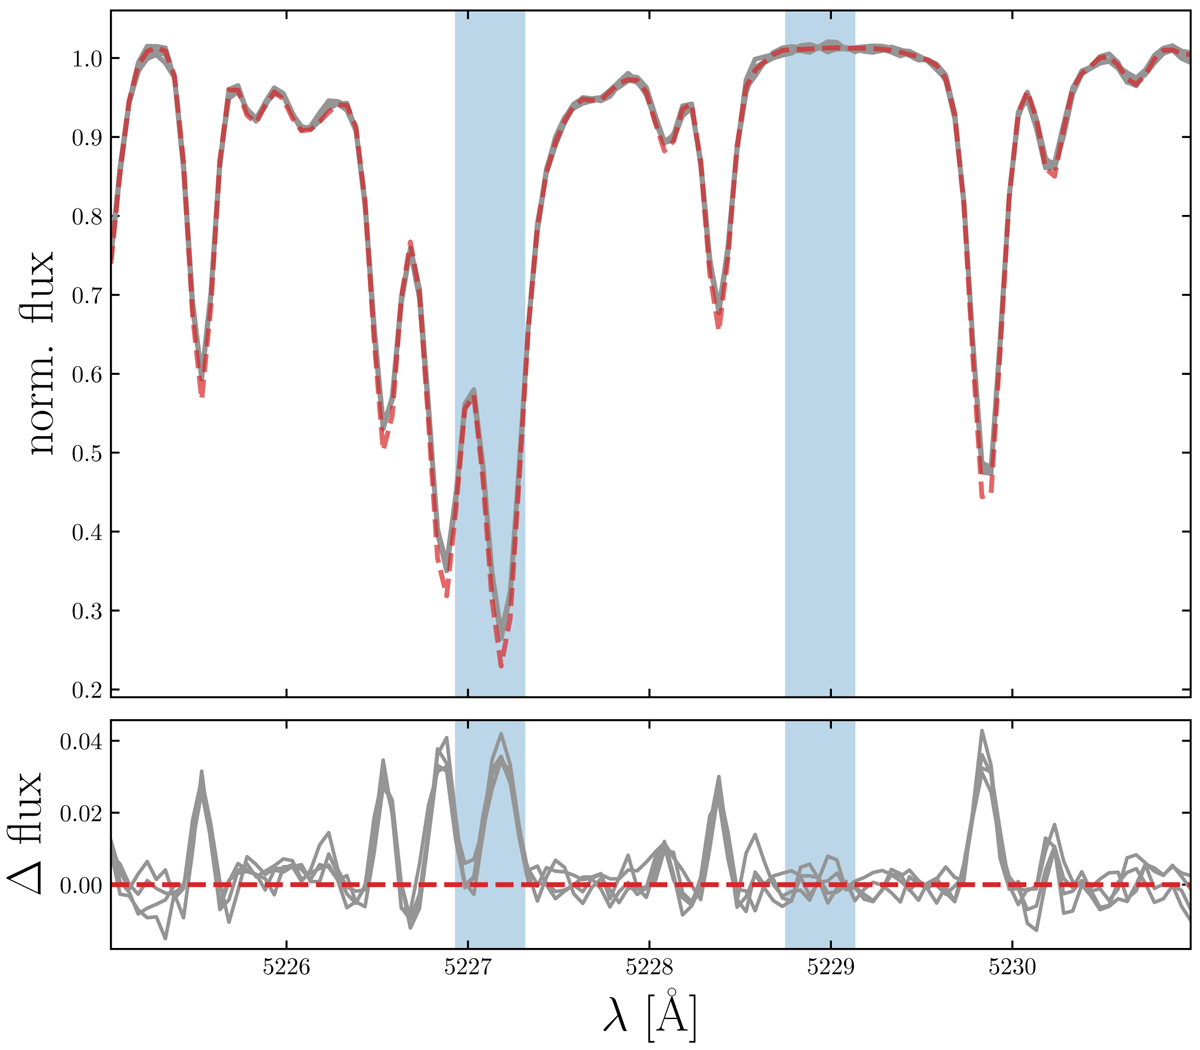
Upper panel: comparison of the four ELODIE spectra for the Sun with S/N > 100 (gray) to the atlas spectrum by Hinkle et al. (2000) (red dashed). The latter was degraded to match the resolution of our training grid and re-sampled to the ELODIE dispersion scale. The blue regions show the fluxes used in one of our [Fe/H] relations. All spectra were normalized to the mean flux in the rightmost blue band. Lower panel: flux residuals.
Current usage metrics show cumulative count of Article Views (full-text article views including HTML views, PDF and ePub downloads, according to the available data) and Abstracts Views on Vision4Press platform.
Data correspond to usage on the plateform after 2015. The current usage metrics is available 48-96 hours after online publication and is updated daily on week days.
Initial download of the metrics may take a while.