Fig. 14.
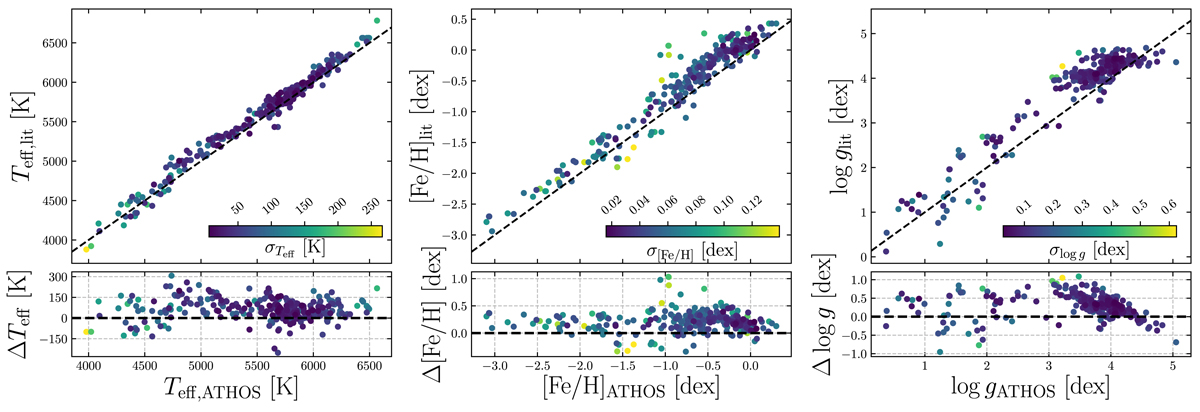
Upper panels: comparison of the ATHOS output for T eff, [Fe/H], and log g with literature results for the ELODIE spectral library (version 3.1, Prugniel et al. 2007, see text for quality cuts made here). In case a star occurs with multiple spectra in the library, it is reflected by more than one point here. Dashed lines represent the one-to-one relation. The colors reflect the internal statistical uncertainties computed with ATHOS. Lower panels: residual distribution. All residuals are determined via Δx = x lit − x ATHOS.
Current usage metrics show cumulative count of Article Views (full-text article views including HTML views, PDF and ePub downloads, according to the available data) and Abstracts Views on Vision4Press platform.
Data correspond to usage on the plateform after 2015. The current usage metrics is available 48-96 hours after online publication and is updated daily on week days.
Initial download of the metrics may take a while.